
Though there are many possible combinations of wavelength bands, the Earth Observatory typically selects one of four combinations based on the event or feature we want to illustrate. For instance, floods are best viewed in shortwave infrared, near infrared, and green light because muddy water blends with brown land in a natural color image. Shortwave infrared light highlights the difference between clouds, ice, and snow, all of which are white in visible light.
Our four most common false-color band combinations are:
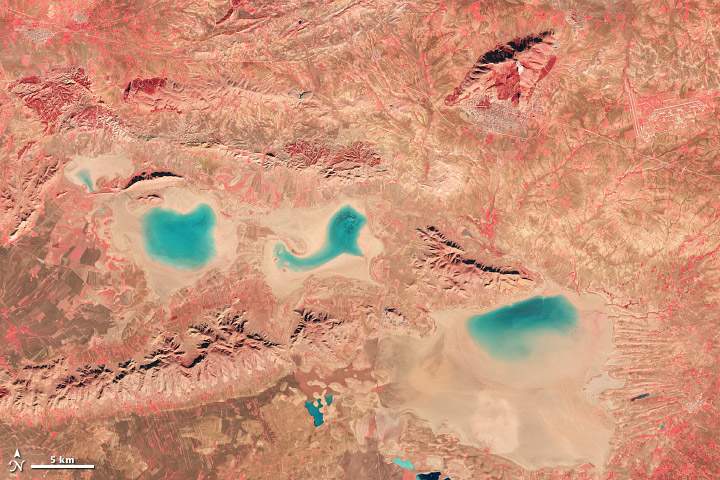
One of our most frequently published combinations uses near infrared light as red, red light as green, and green light as blue. In this case, plants reflect near infrared and green light, while absorbing red. Since they reflect more near infrared than green, plant-covered land appears deep red. The signal from plants is so strong that red dominates the false-color view of Algeria below. Denser plant growth is darker red. This band combination is valuable for gauging plant health.
Cities and exposed ground are gray or tan, and clear water is black. In the image below, the water is muddy, and the sediment reflects light. This makes the water look blue. Images from the Advanced Spaceborne Thermal Emission and Reflection Radiometer (ASTER) and from the early Landsats are often shown in this band combination because that’s what the instruments measured.

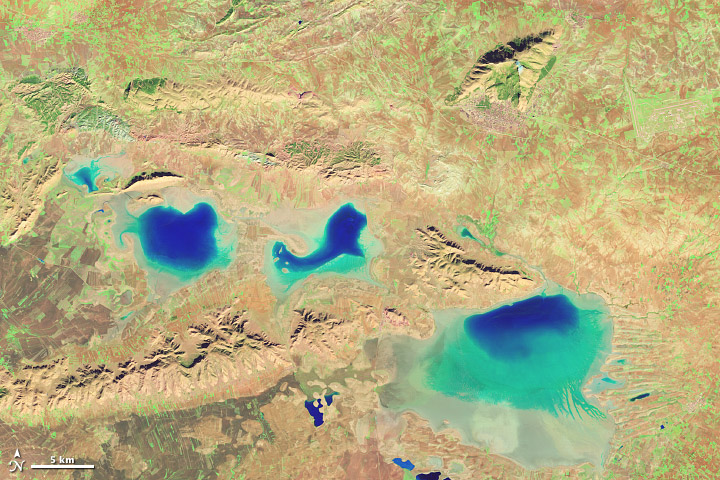
The most common false-color band combination on the Earth Observatory uses the shortwave infrared (shown as red), the near infrared (green), and the green visible band (shown as blue).
Water absorbs all three wavelengths, so it is black in this band combination. In the below false-color image of Algeria, however, water is blue because it is full of sediment. Sediment reflects visible light, which is assigned to look blue in this band combination. This means that both sediment-laden water and saturated soil will appear blue. Because water and wet soil stand out in this band combination, it is valuable for monitoring floods. Saturated soil will also appear blue. Ice clouds, snow, and ice are bright blue, since ice reflects visible light and absorbs infrared. This helps distinguish water from snow and ice; it also distinguishes clouds made up mostly of liquid water or ice crystals.

Newly burned land reflects shortwave infrared light and appears red in this combination. Hot areas like lava flows or fires are also bright red or orange. Exposed, bare earth generally reflects shortwave infrared light and tends to have a red or pink tone. Urban areas are usually silver or purple, depending on the building material and how dense the area is.
Since plants reflect near infrared light very strongly, vegetated areas are bright green. The signal is so strong that green often dominates the scene. Even the sparse vegetation in Algeria’s desert landscape stands out as bright green spots in the above image.
Occasionally, the Earth Observatory will publish a band combination that assigns blue light to be red and two different shortwave infrared bands to green and blue. This band combination is especially valuable in distinguishing snow, ice, and clouds. Ice reflects more blue light than snow or ice clouds. Ice on the ground will be bright red in this false color, while snow is orange, and clouds range from white to dark peach.
A combo of blue and shortwave infrared light contrasts clouds, snow, and ice in a large winter storm from January 2014. (NASA image by Jesse Allen and Robert Simmon; data from LANCE/EOSDIS Rapid Response.)
The Earth Observatory also uses thermal infrared measurements to show land temperatures, fire areas, or volcanic flows, but most of the time, these are published as grayscale images. Occasionally, the thermal features of interest will be layered on top of a true-color or grayscale image, particularly in the case of a fire or volcano.
Infrared light reveals details of the evolving lava flows on Russia’s Tolbachik Volcano. (NASA image by Jesse Allen and Robert Simmon, using EO-1 ALI data from the NASA EO-1 team.)
You can explore the way different band combinations highlight different features by using a browse tool called Worldview, which displays data from many different imagers, including Aqua and Terra MODIS. Click on “add layers” and then select one of the alternate band combinations (1-2-1, 3-6-7, or 7-2-1). The site also provides descriptions of common MODIS band combinations.
You can also explore false color imagery with Landsat. See a few examples with a description in the Landsat 7 Compositor, or watch this animation of the Florida Everglades in three different band combinations. You can also make your own Landsat images and experiment with band combinations by using software like Adobe Photoshop or ImageJ. Download data for free from the U.S. Geological Survey, then follow the instructions for Photoshop or ImageJ.
Thanks to the following science reviewers and/or content providers: Michael King, Vincent Salomonson, David Mayer, Patricia Pavon and Belen Franch.