
We learned in school that plants take in CO2 and water and use light to drive photosynthesis to grow. But what you may not know is that as part of the process of photosynthesis plants also emit light, called chlorophyll fluorescence. The fluoresced light provides information about the rate of photosynthesis and plant responses to stress. Although the fluoresced light is very dim, we can use sensitive instruments to measure that fluorescence, and this can be done even with satellite instruments in space.
Arctic tundra is the coldest ecological community. It circles the high latitudes of the northern hemisphere which is experiencing strong climate changes that affects the growth of tundra plants. Much of the tundra regions are remote and very hard to reach, so it is difficult for us to know just how tundra is responding to climate change. Satellites flying overhead can provide information about the tundra across the entire region, even in all of those difficult to reach places. In our project, “clarifying linkages between canopy SIF and physiological function for high latitude vegetation,” we want to learn how to use the fluorescence signal to describe the functioning of the tundra ecosystem so that we can understand how the diverse tundra vegetation is responding to climate change and make the best use of satellite images of this region. Our project is part of the NASA Terrestrial Ecology program’s Arctic-Boreal Vulnerability Experiment (ABoVE), a large-scale field study in Alaska and western Canada, whose overall goals are to make use of NASA technology to gain a better understanding of ecosystems at high latitudes, their responses to environmental change, and the effects of those changes.
This took our team—from the University of Maryland Baltimore County, NASA’s Goddard Space Flight Center, and the University of Texas El Paso—north to Utqiaġvik (formerly Barrow) Alaska on the shores of the Arctic Ocean. Utqiaġvik, the northernmost city in the United States, is on the lands of the Iñupiat people. There are no roads to Utqiaġvik, so all of our equipment had to be shipped by air up there.
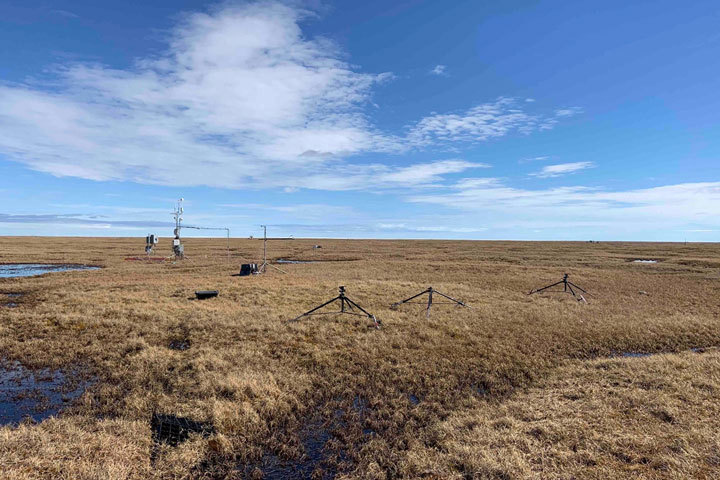
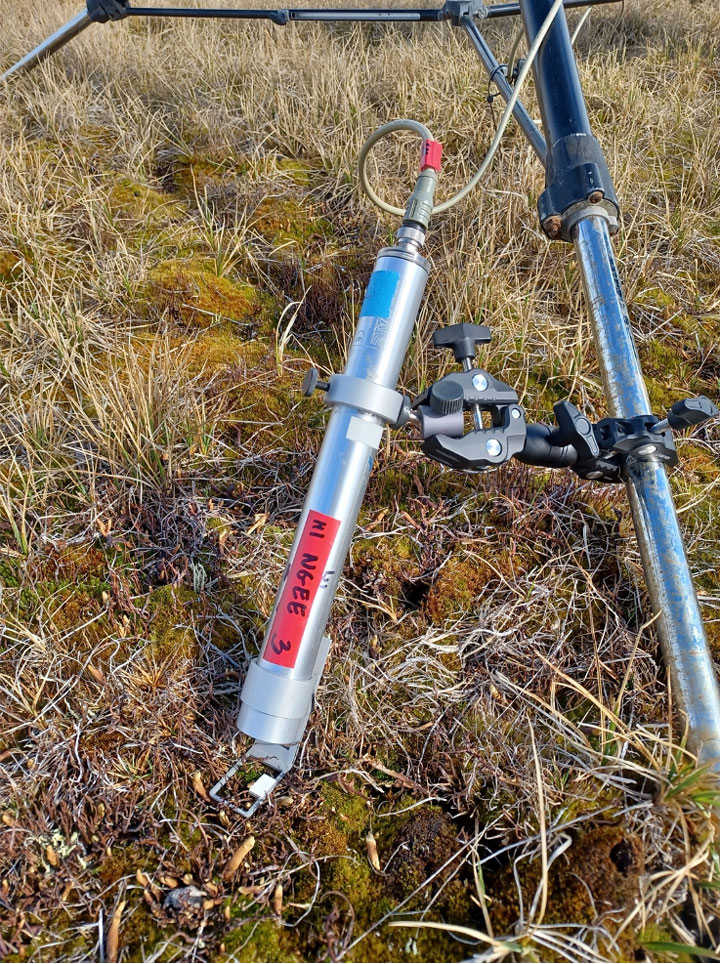
The goal of our June campaign was to install automated sensors to capture the springtime green-up of the tundra. Even though it is June and after the official first day of summer, spring is just starting in Utqiaġvik. There is ice in the ocean (Figure 1), the snow is just melting off the land, and the tundra is brown. Our instruments include the FLoX (Fluorescence Box) that measures the reflected light and solar induced chlorophyll fluorescence of patches of the tundra (Figures 2, 3 and 4) and the monitoring PAM (MoniPAM) whose probes illuminate small patches of leaves or moss with controlled pulses of light to measure fluorescence and photosynthetic processes at the leaf level (Figure 5). These instruments automatically measure the fluorescence throughout the day to observe the effects of varying light levels and temperatures and through the course of the growing season as the tundra plants grow. The FLoX gives us measurements that are similar to the kinds of data we can get from satellite. Making these measurements on the ground lets us know exactly what we are looking at, which helps better understand what the data mean.
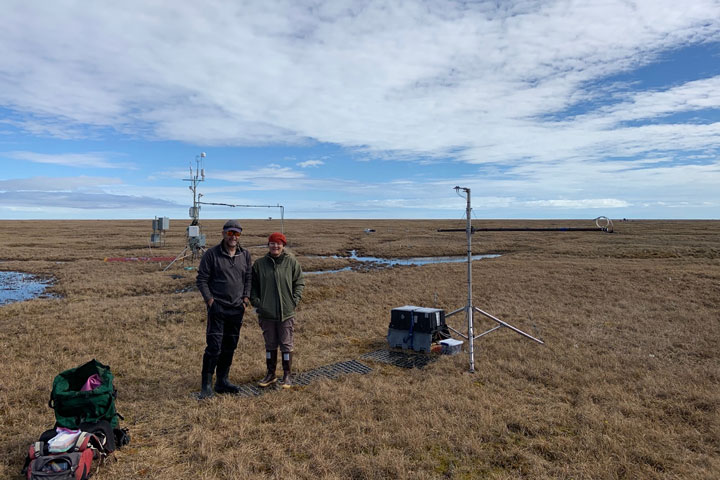
stand next to the FLoX at the NGEE Arctic site. The box at the base of the tripod holds the instrument which gets light through a fiber optic cable that runs from the end of the horizontal pole on the tripod.
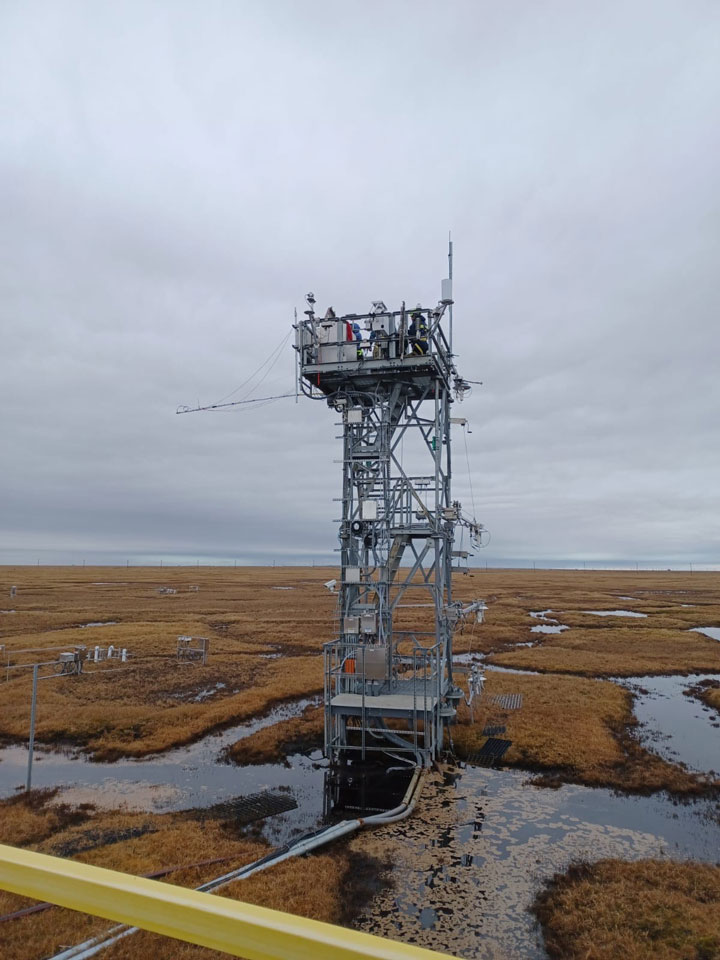
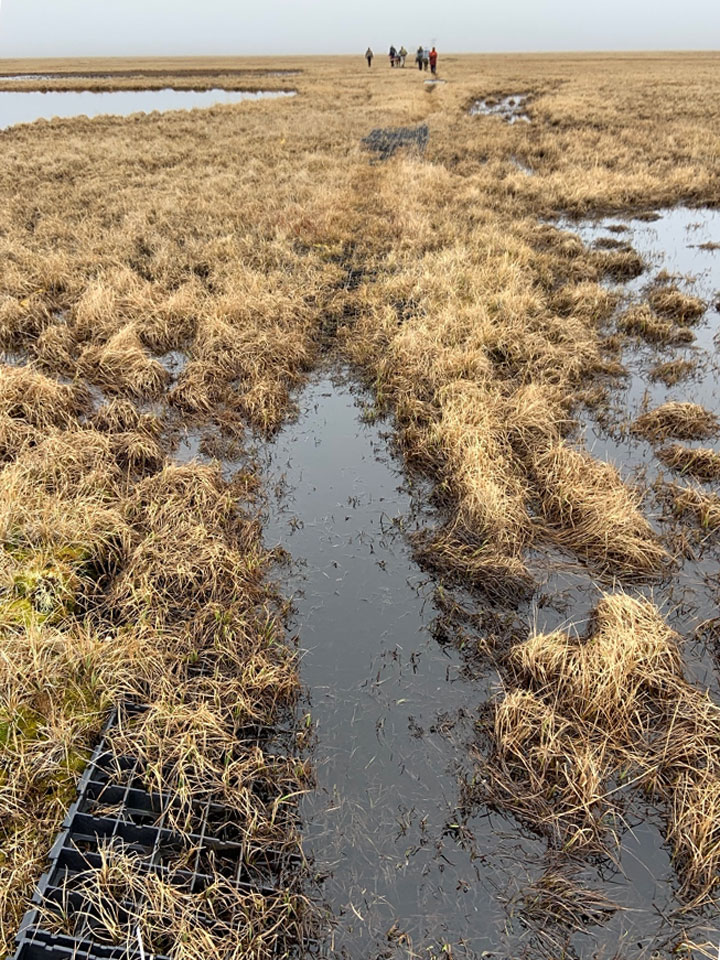
Our instruments are deployed at existing flux tower sites. Flux towers measure water, heat, and carbon dioxide exchange between the ground and the atmosphere as well as provide weather data. The flux towers were about a mile from the nearest road, so all of our equipment had to be backpacked into the sites (Figures 6 and 7). It is a soggy hike in because this time of year the tundra is very wet, since the snow has just melted and the soil is still frozen keeping the water from seeping into the ground (Figure 8).
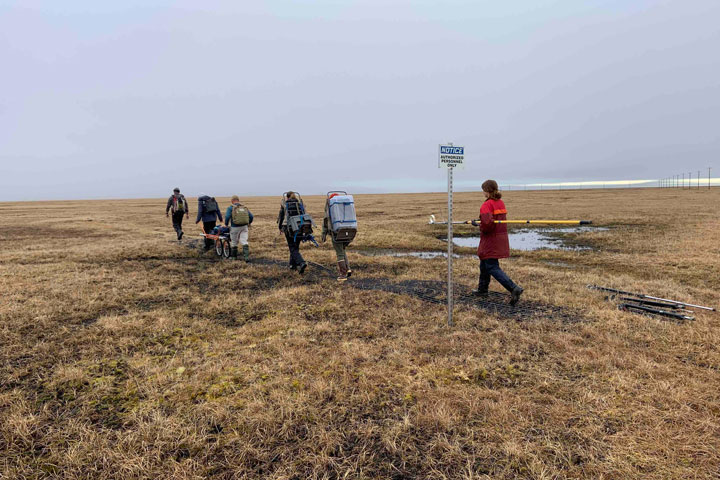
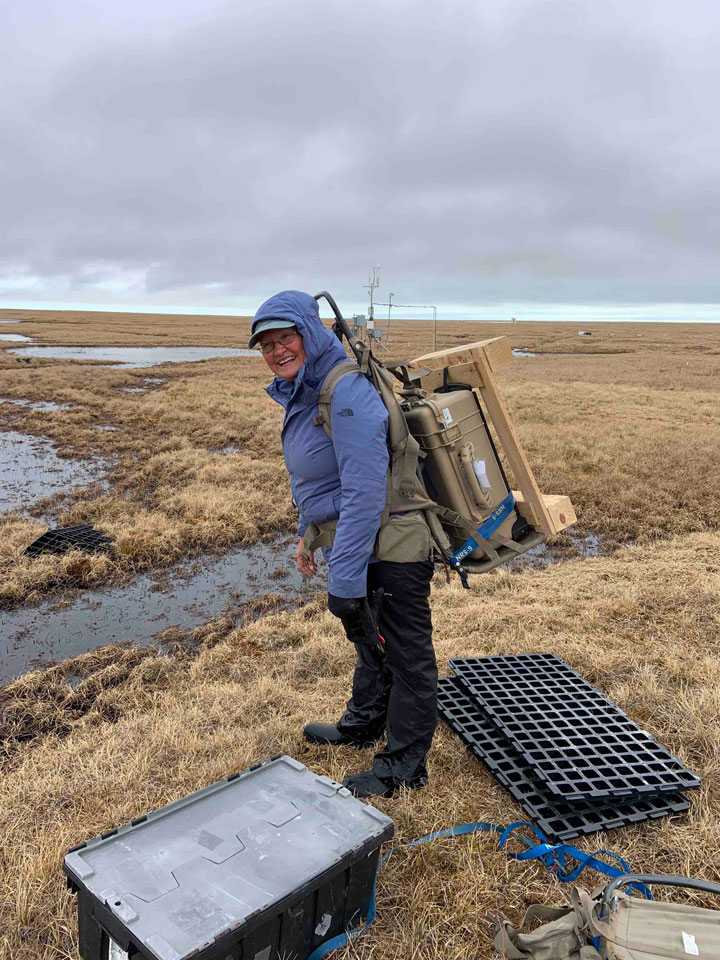
One site is the Department of Energy Next Generation Ecosystem Experiment (NGEE) Arctic flux tower and here we are measuring a drier tundra site (Figures 2 and 4). The other site is the National Science Foundation’s National Ecological Observatory Network (NEON) flux tower (Figure 3), which is a wetter site. We use the flux data to determine photosynthesis rates to compare with our measurements of fluorescence to develop approaches for relating remotely sensed optical measurements to tundra ecosystem productivity.
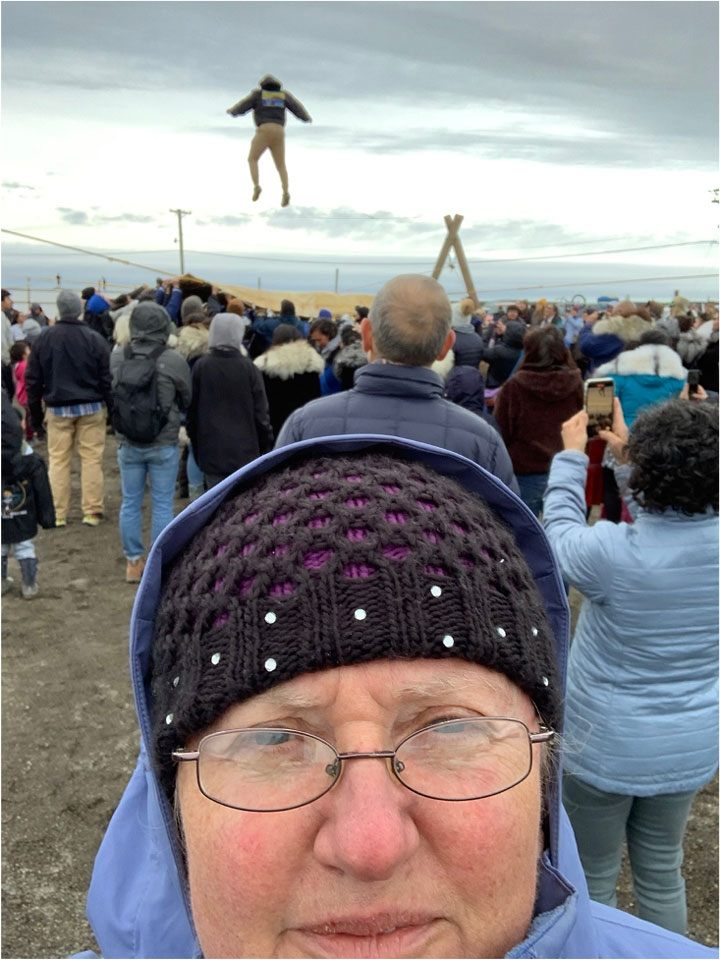
The trip wasn’t all work, Petya Campbell and students were able to attend a Nalukataq, the Iñupiat whaling festival, and see the traditional blanket toss that throws the blanket dancer high into the air (Figure 9).
We will return in August at the time of peak growth of the tundra to collect further measurements of fluorescence and productivity to add to the seasonal descriptions of fluorescence from these automated sensors.


Great story – it’s so important to increase our understanding of tundra functioning and changes!