The big science highlight so far is that over May 2 through May 4, the GPM Ground Validation team finally collected a coordinated, co-scanned multi-radar frequency and dual-polarimetric dataset with the D3R and NPOL radars and we did it in one of the most complex multi-day precipitation events that we’ll measure in mid and high latitudes – a mixture of rain, snow and sleet.

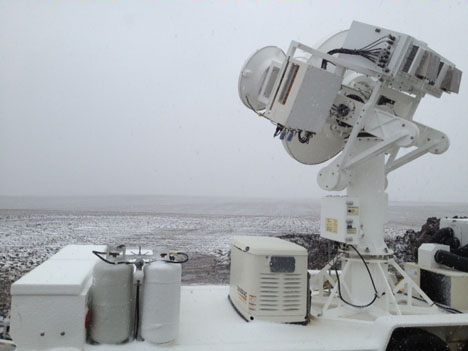
May 3, 2013. The D3R radar, which measures precipitation at similar frequencies as the radar on the GPM Core satellite, measured rain, snow, and sleet at the Traer site in Iowa. Credit: Walt Petersen / NASA
In fact, the snowfall portion of the storm turned out to be a record event for Iowa in May. The fact that D3R and NPOL co-scanned the event is important because you have a longer wavelength, high power reference radar (NPOL) with dual-polarization (both vertical and horizontal scans), and hence enhanced capability to discern specifics on precipitation shapes, sizes and numbers, scanning coincident with a radar (D3R) that carries the same higher frequencies that the DPR radar will carry on the GPM Core Satellite.
The higher frequencies of the D3R are more sensitive, but will often attenuate, or dissipate, faster in the mixture of precipitation we sampled. So, you can test how well you can correct for that attenuation and retrieve the complex precipitation structure from the D3R, which is our proxy for the space-borne radar, against your reference platform, the NPOL. At the same time, we learn a great deal about the precipitation physics when we look at things with 3 different frequencies and in dual-polarization modes.

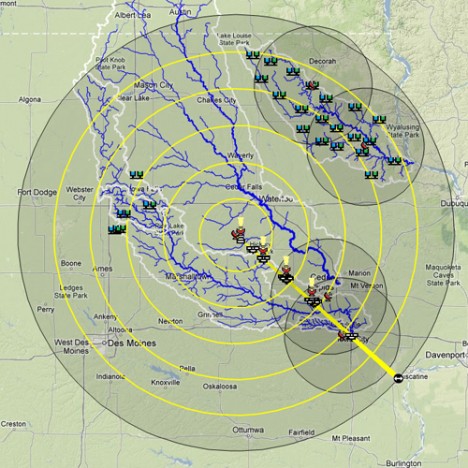
Map of field locations of IFloodS instruments. The NPOL and D3R radars are located dead center and a ray of disdrometers and rain gauges stretches southeast toward Iowa City in the bottom right. Other rain sensors are distributed throughout the Turkey River basin in the north east and the south fork of the Iowa river west of Traer. Credit: Iowa Flood Center
Moreover, we did this over a “reference” 100 km-long ray of disdrometers, vertically pointing micro rain radars, and rain gauges – all in all, what will probably amount to a great deal of information to interpret.
From May 1 to June 15, NASA and Iowa Flood Center scientists from the University of Iowa will measure rainfall in eastern Iowa with ground instruments and satellites as part of a field campaign called Iowa Flood Studies (IFloodS). They will evaluate the accuracy of flood forecasting models and precipitation measurements from space with data they collect. Walt Petersen, a scientist based at NASA’s Wallops Flight Facility, is the Ground Validation Scientist for the Global Precipitation Measurement (GPM) mission.


