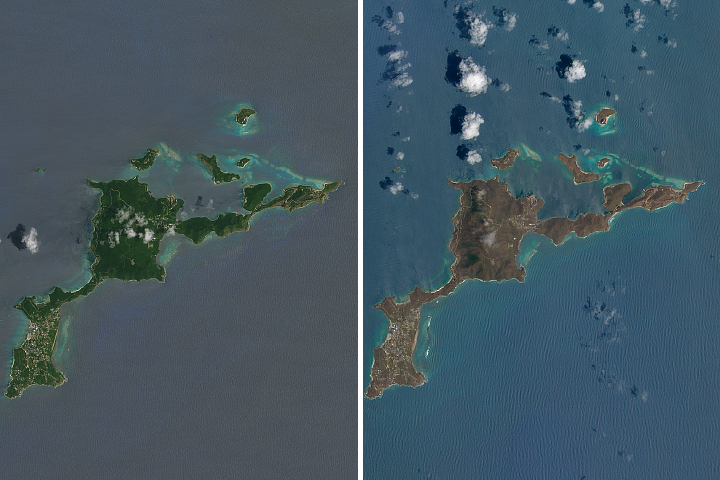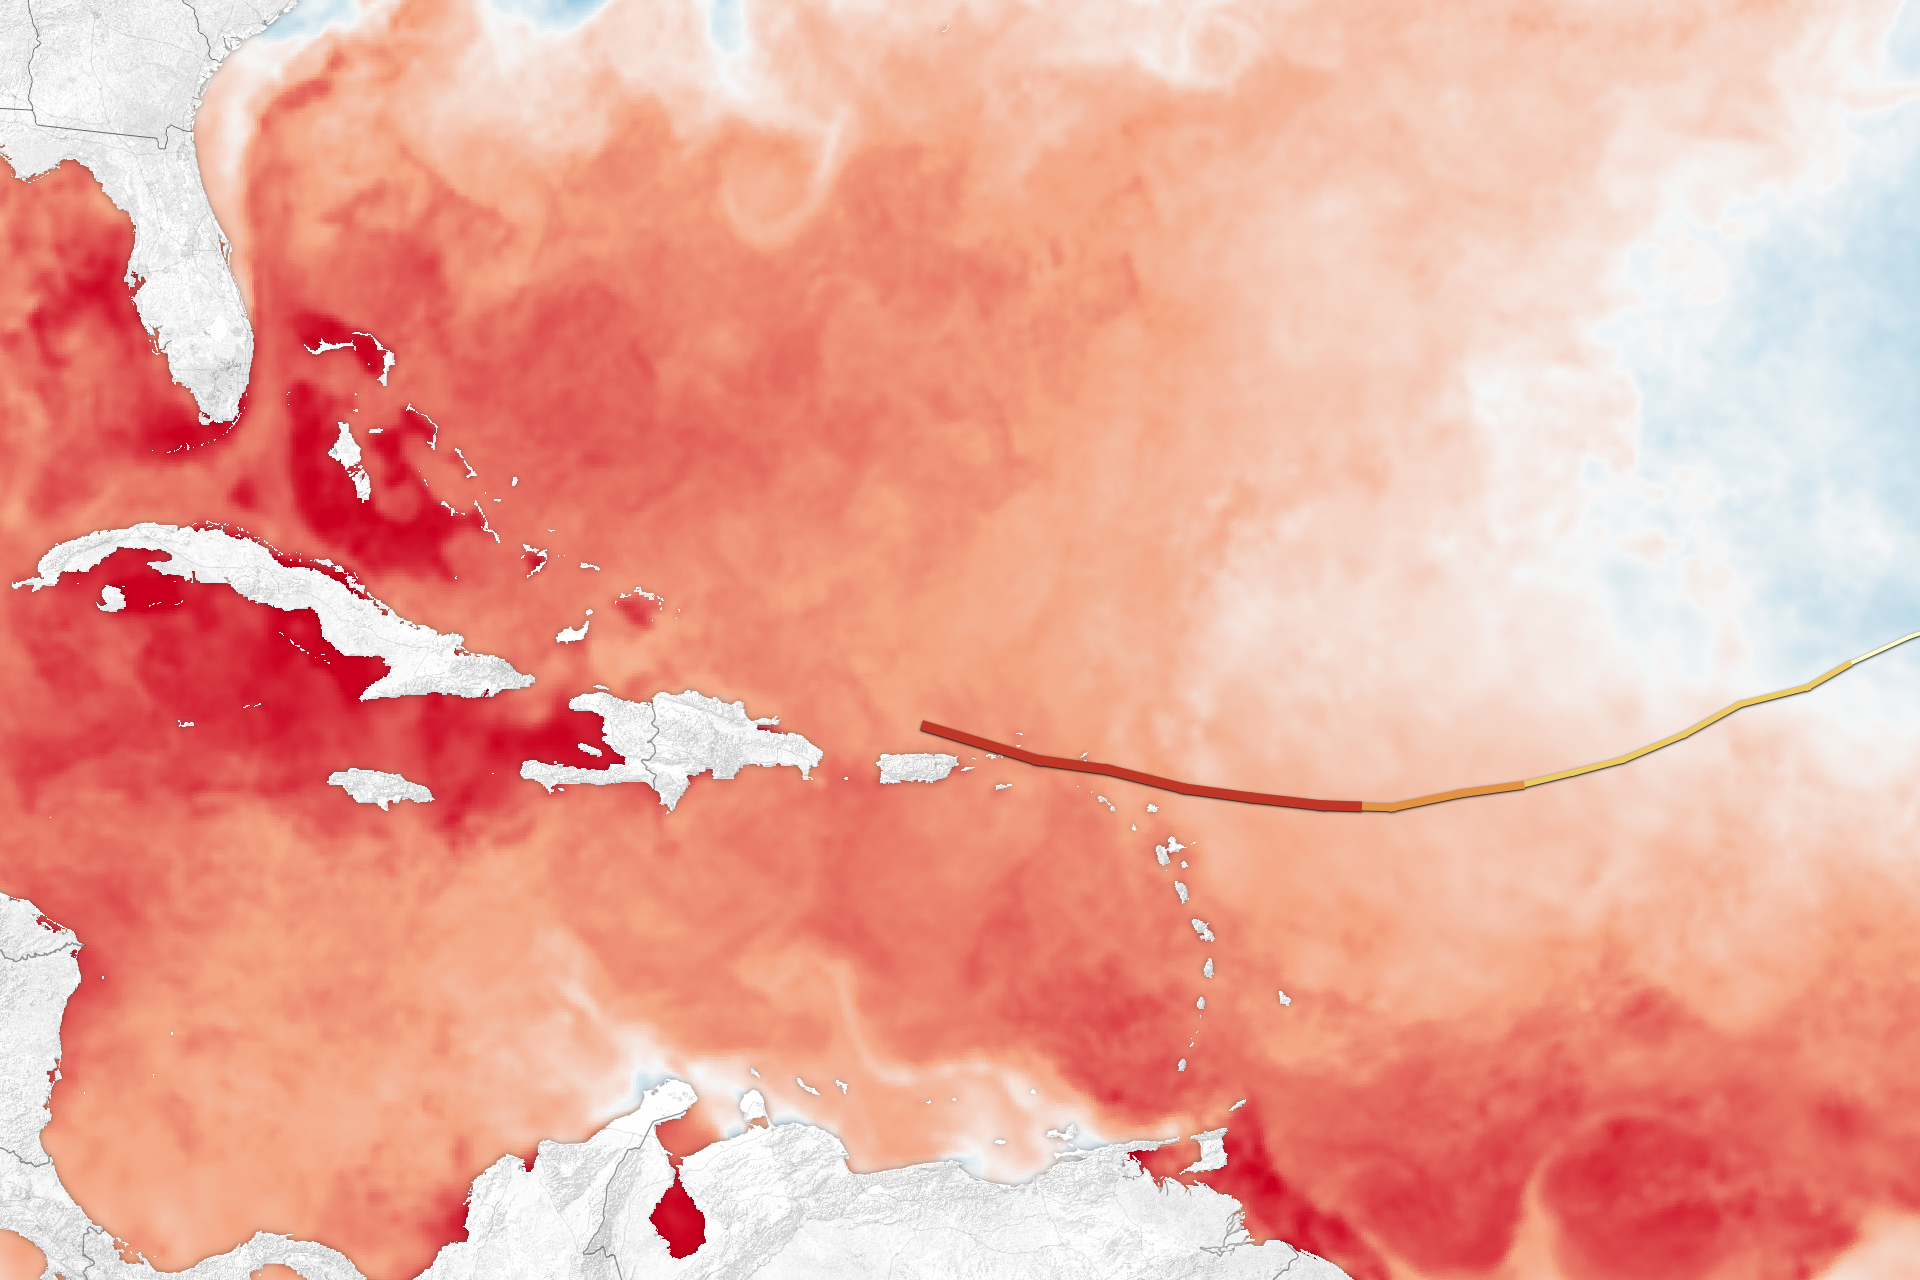
On September 6, 2017, Hurricane Irma slammed into the Leeward Islands on its way toward Puerto Rico, Cuba, and the U.S. mainland. As the category 5 storm approaches the Bahamas and Florida in the coming days, it will be passing over waters that are warmer than 30 degrees Celsius (86 degrees Fahrenheit)—hot enough to sustain a category 5 storm. Warm oceans, along with low wind shear, are two key ingredients that fuel and sustain hurricanes.
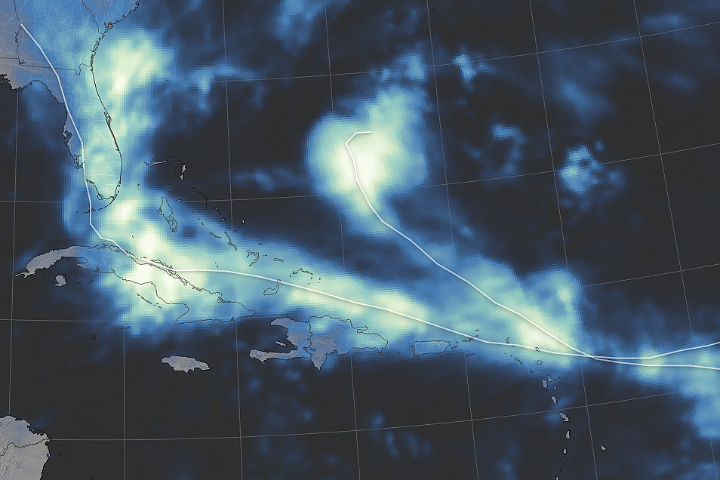
The map above shows sea surface temperatures in the Atlantic Ocean, Caribbean Sea, and Gulf of Mexico on September 5, 2017. The data were compiled by Coral Reef Watch, which blends observations from the Suomi NPP, MTSAT, Meteosat, and GOES satellites and computer models. The mid-point of the color scale is 27.8°C, a threshold that scientists generally believe to be warm enough to fuel a hurricane. The yellow-to-red line on the map represents Irma’s track from September 3–6.
By definition, category 5 storms deliver maximum sustained winds of at least 157 miles (252 kilometers) per hour. When it hit the Leeward Islands, Irma’s winds surpassed 185 miles (295 kilometers) per hour, making it the strongest storm to ever hit the islands and one of the strongest storms ever measured in the Atlantic basin.
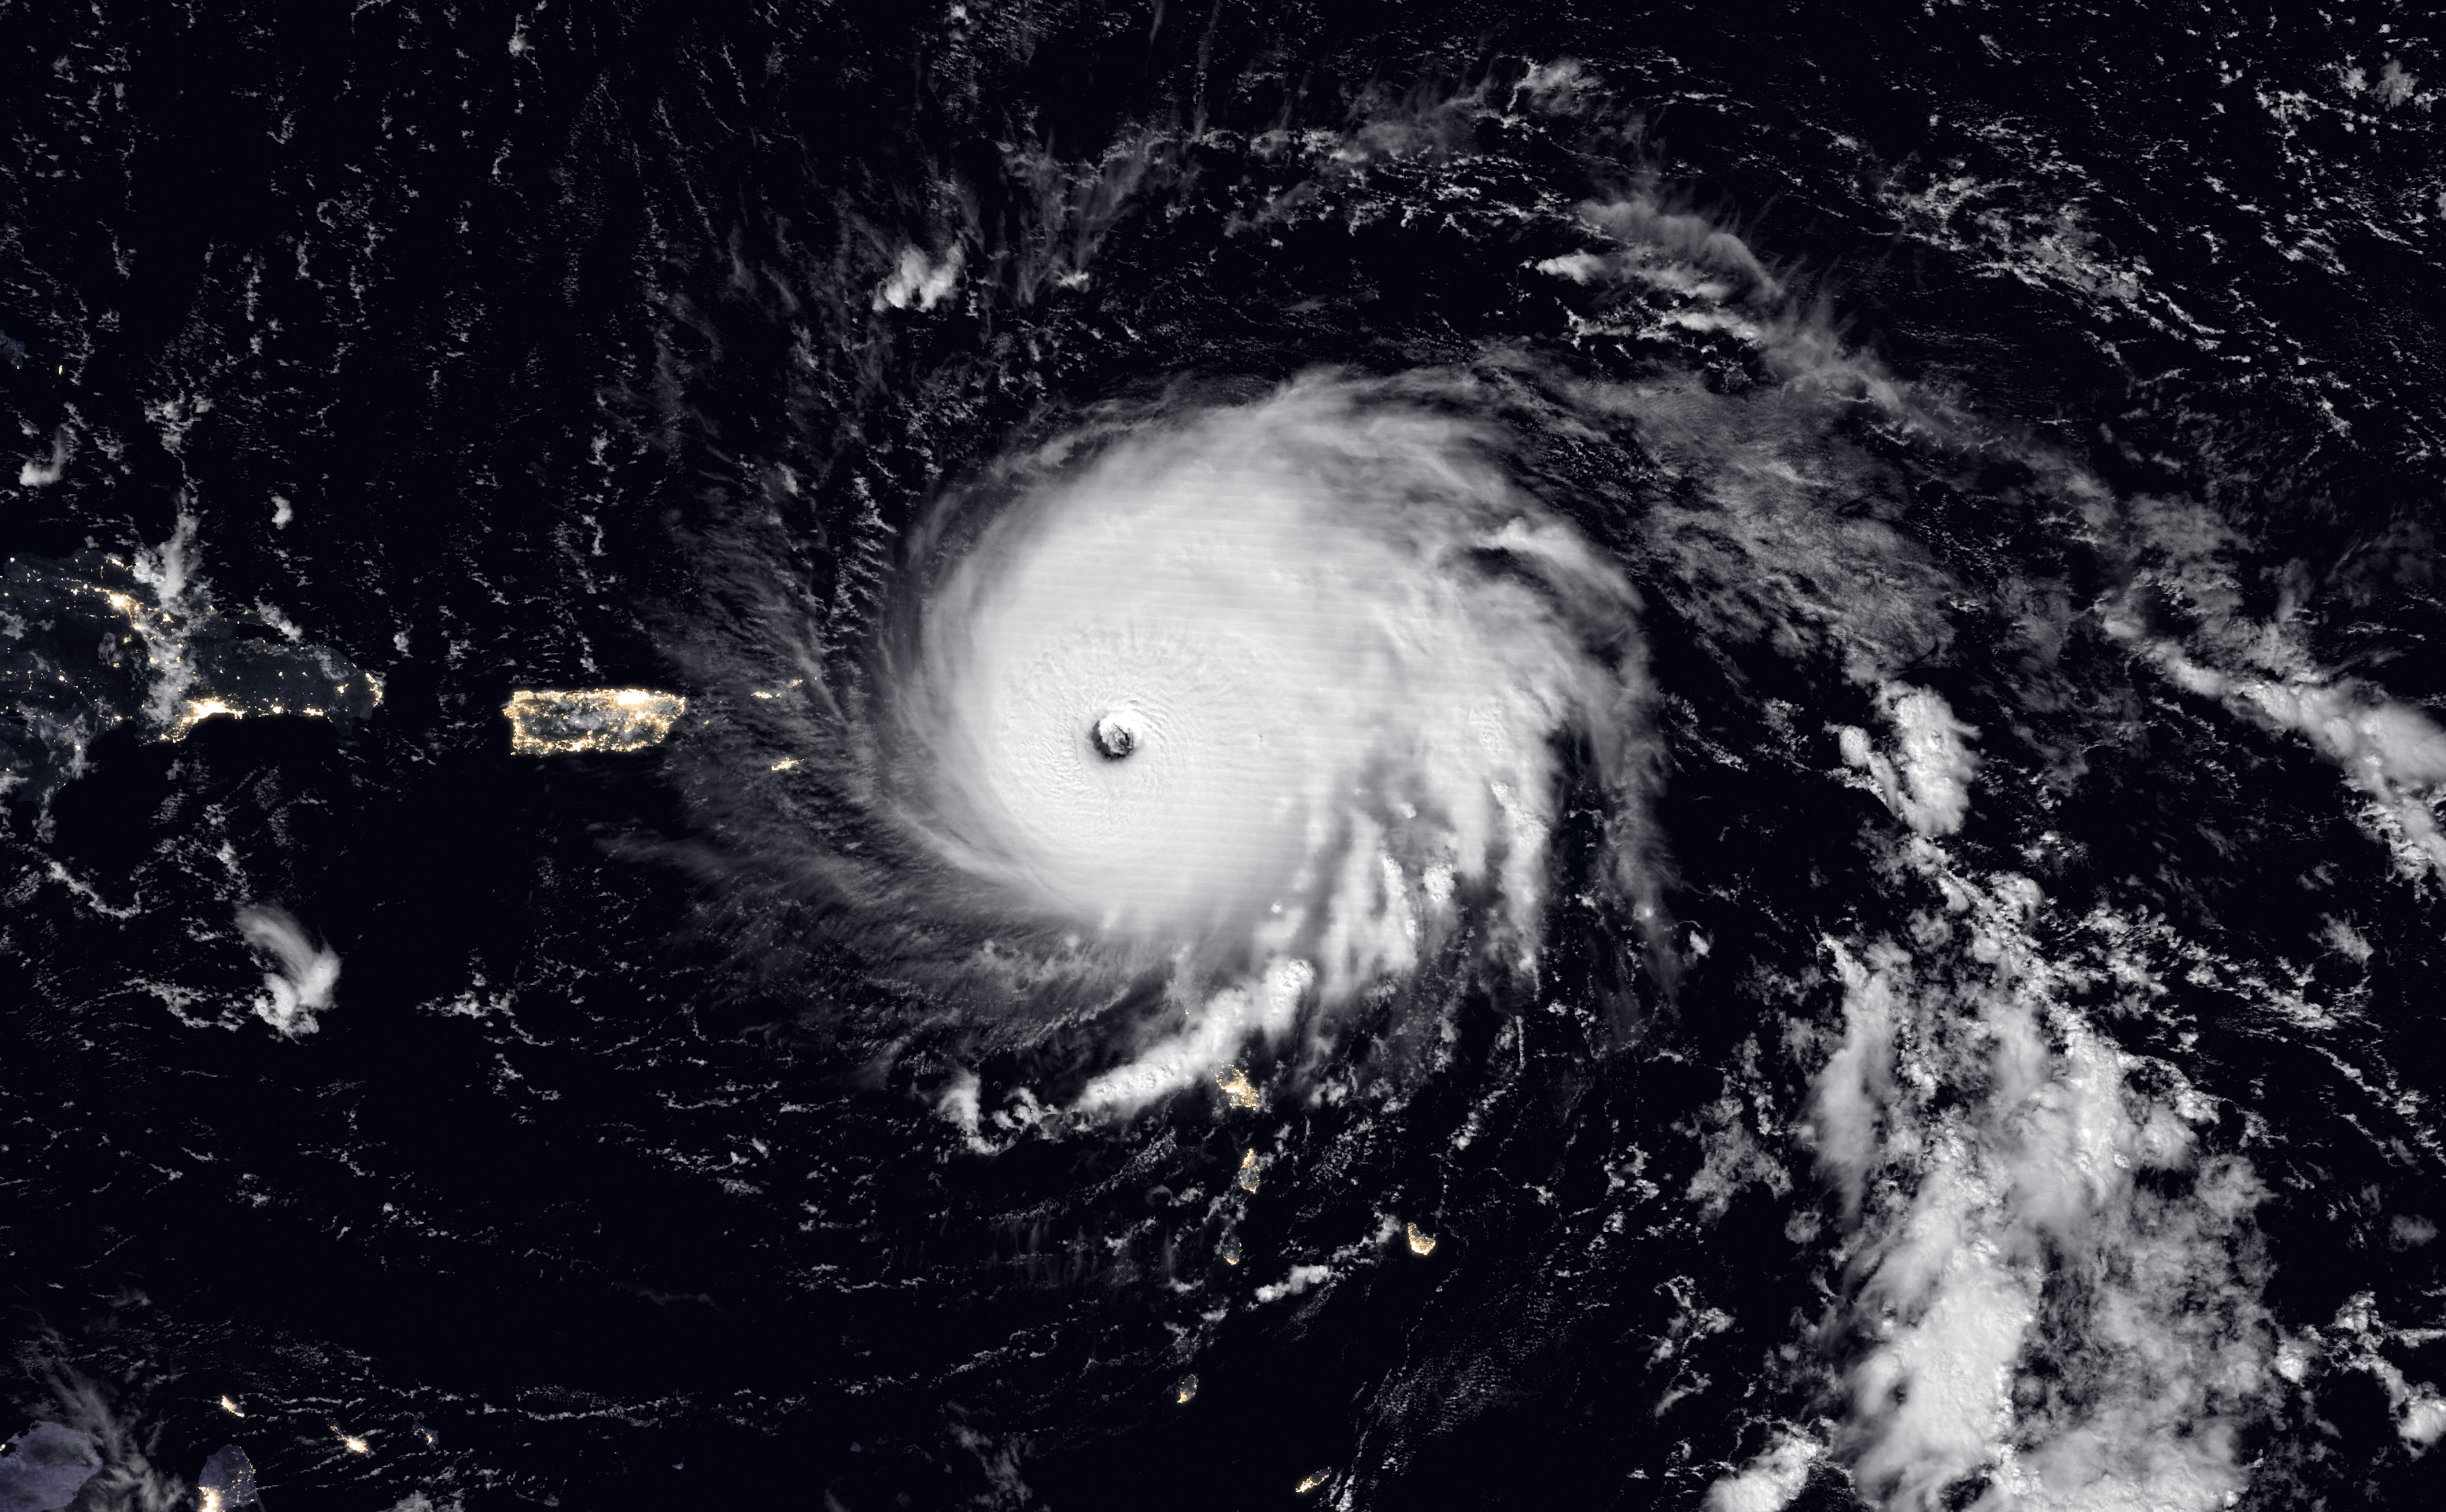
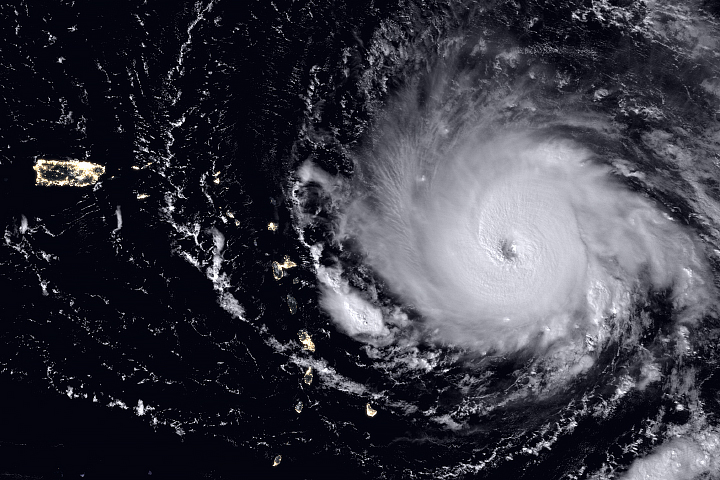
The Visible Infrared Imaging Radiometer Suite (VIIRS) on the Suomi NPP satellite captured a nighttime view of the storm at 1:35 a.m. local time (05:35 Universal Time) on September 6 as the eye was over the island of Barbuda. The image was acquired by the VIIRS “day-night band,” which detects light in a range of wavelengths from green to near-infrared and uses filtering techniques to observe signals such as city lights, auroras, wildfires, and reflected moonlight. In this case, the clouds were lit by the full Moon. The image is a composite, showing storm imagery combined with VIIRS imagery of city lights.
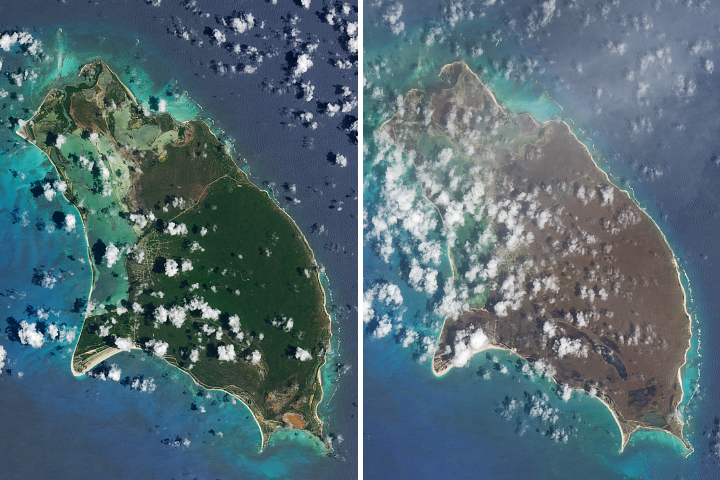
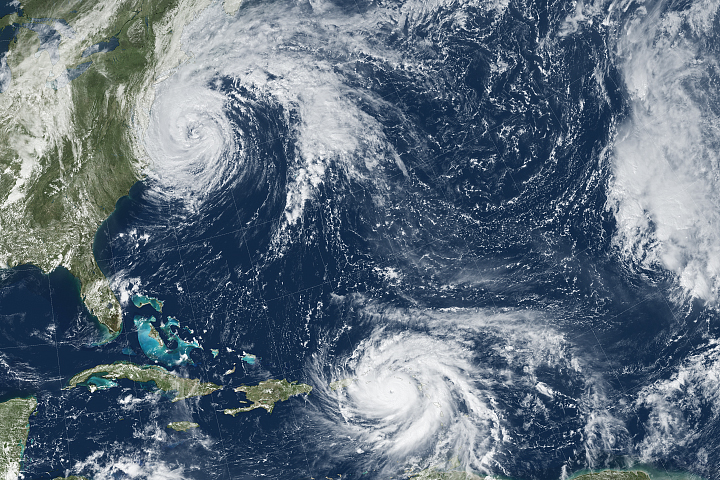
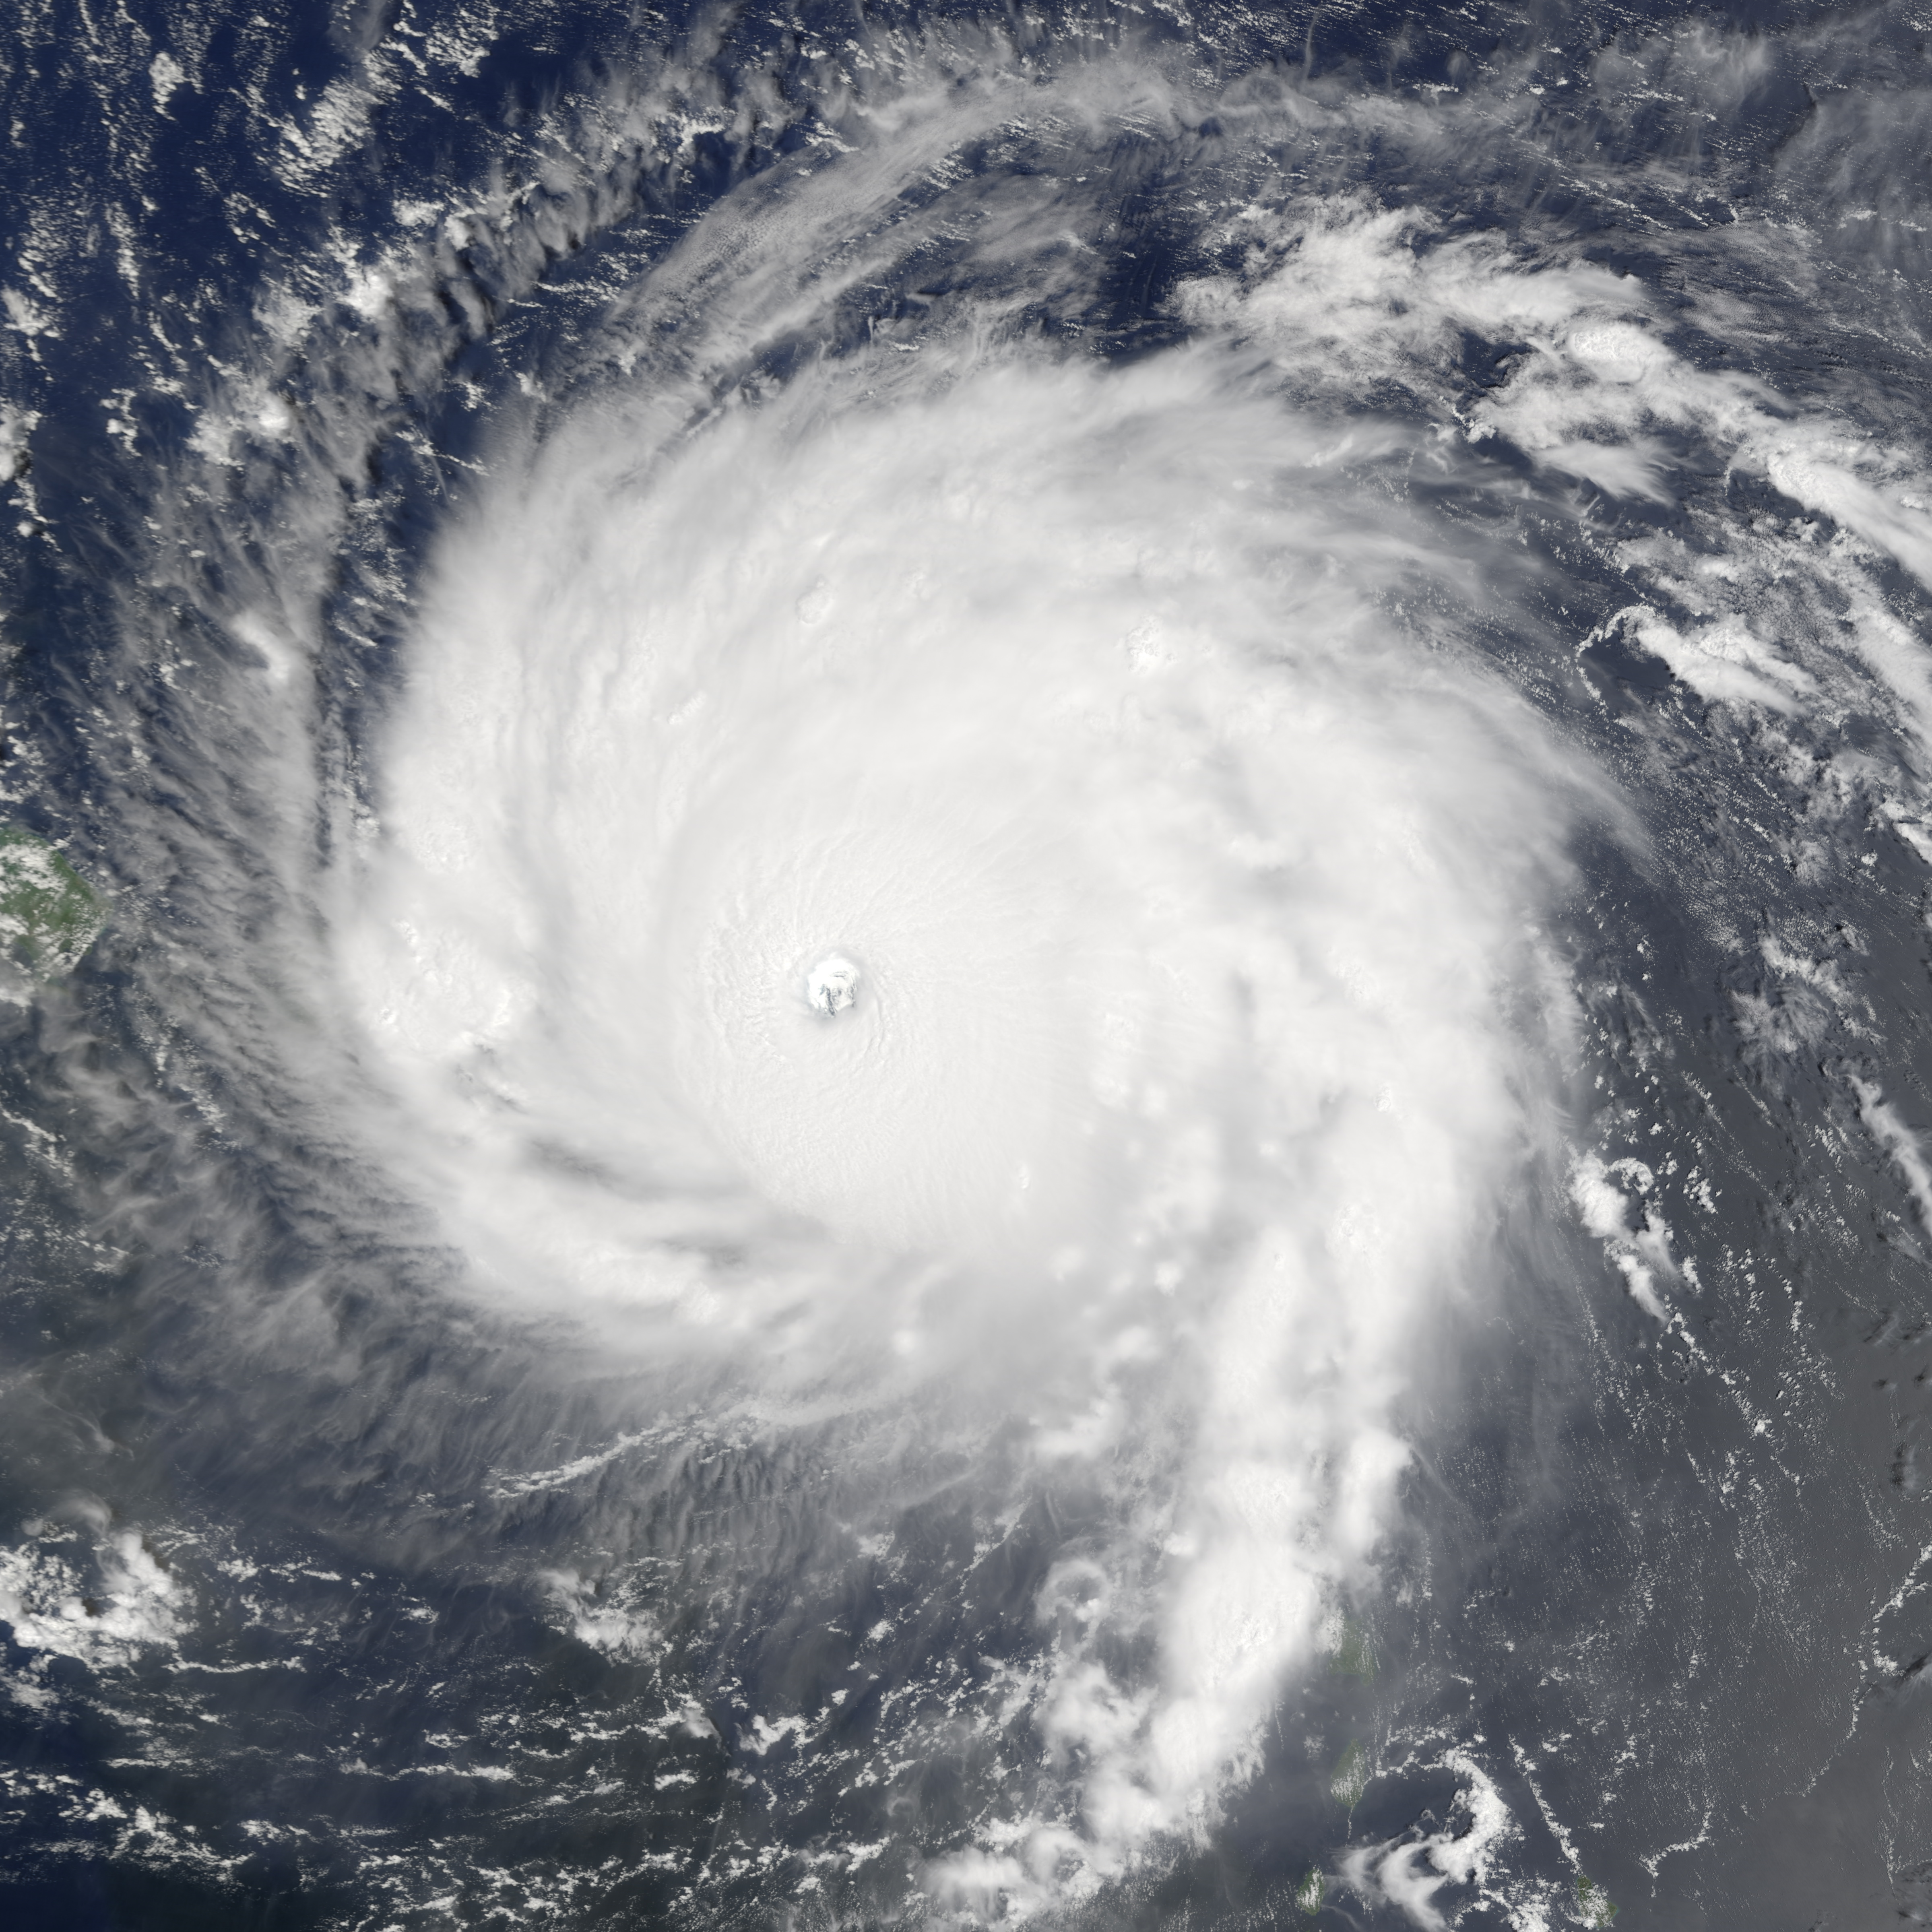
The Moderate Resolution Imaging Spectroradiometer (MODIS) on NASA’s Terra satellite acquired the third image at 10:35 a.m. local time (14:35 Universal Time) on September 6, 2017. By then, the storm had also hit Anguilla and was poised to strike the Virgin Islands.
Irma’s winds are not only strong; they are spread across a remarkably wide area. Hurricane-force winds extend 50 miles (85 kilometers) from the center; tropical-storm-force winds extend up to 185 miles (295 kilometers). Meteorologists noted that the hurricane had the lowest central pressure (914 millibars) ever for a storm outside of the Gulf of Mexico and western Caribbean.
By September 6, Irma had already generated more accumulated cyclone energy—a term meteorologists use to describe the destructive potential of a hurricane—than the first eight named storms of the 2017 Atlantic hurricane season combined, according to meteorologist Philip Klotzbach of Colorado State University. Irma even broke a record for generating the most accumulated cyclone energy in a 24-hour period.
The latest National Hurricane Center forecast calls for the hurricane to turn north-northwest after grazing Puerto Rico, the Dominican Republic, and Haiti. After that, the forecast shows Irma’s path will likely move over or near the Turks and Caicos Islands, the Bahamas, and may eventually make landfall in Florida.
Forecasting hurricane behavior remains complex and challenging, but meteorologists have become much more skilled at predicting both the track and intensity of these storms over the past decade. “The five-day track forecasts are now as good as the two-day forecasts were back in 1985,” said Scott Braun, a research meteorologist at NASA’s Goddard Space Flight Center. “Intensity forecasts were slower to improve, but did pick up after 2009. A lot of the improvements came from investments that led to better models, the increased use of forecast ensembles, and improved data assimilation techniques.”
If you live anywhere near the possible path of Hurricane Irma, please visit the Department of Homeland Security’s hurricane readiness page.
NASA Earth Observatory images by Joshua Stevens and Jesse Allen, using VIIRS day-night band data from the Suomi National Polar-orbiting Partnership, MODIS data from the Land Atmosphere Near real-time Capability for EOS (LANCE), sea surface temperature data from Coral Reef Watch, and storm track information from Unisys. Story by Adam Voiland.