In a first-of-its-kind study, scientists combined satellite observations with data on human activities to map the locations where freshwater is changing on Earth. The study, published in the journal Nature on May 16, 2018, finds that Earth’s wet landscapes are getting wetter and dry areas are getting drier due to a variety of factors, including water management, climate change, and natural cycles.
A team led by Matt Rodell of NASA’s Goddard Space Flight Center analyzed 14 years of observations from the Gravity Recovery and Climate Experiment (GRACE) to track trends in freshwater in 34 regions around the world. To put those trends in context, the scientists correlated GRACE findings with precipitation data from the Global Precipitation Climatology Project; with land cover imagery and data from Landsat; with irrigation maps; and with published reports of human activities in agriculture, mining, and reservoir operations.
“This is the first time that we’ve used observations from multiple satellites in a thorough assessment of how freshwater availability is changing everywhere on Earth,” said Rodell. “A key goal was to distinguish shifts in terrestrial water storage caused by natural variability—wet periods and dry periods associated with El Niño and La Niña, for example—from trends related to climate change or human impacts, like pumping groundwater out of an aquifer faster than it is replenished.”
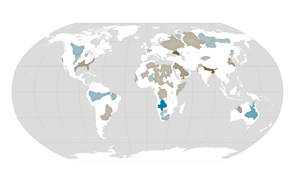
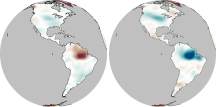
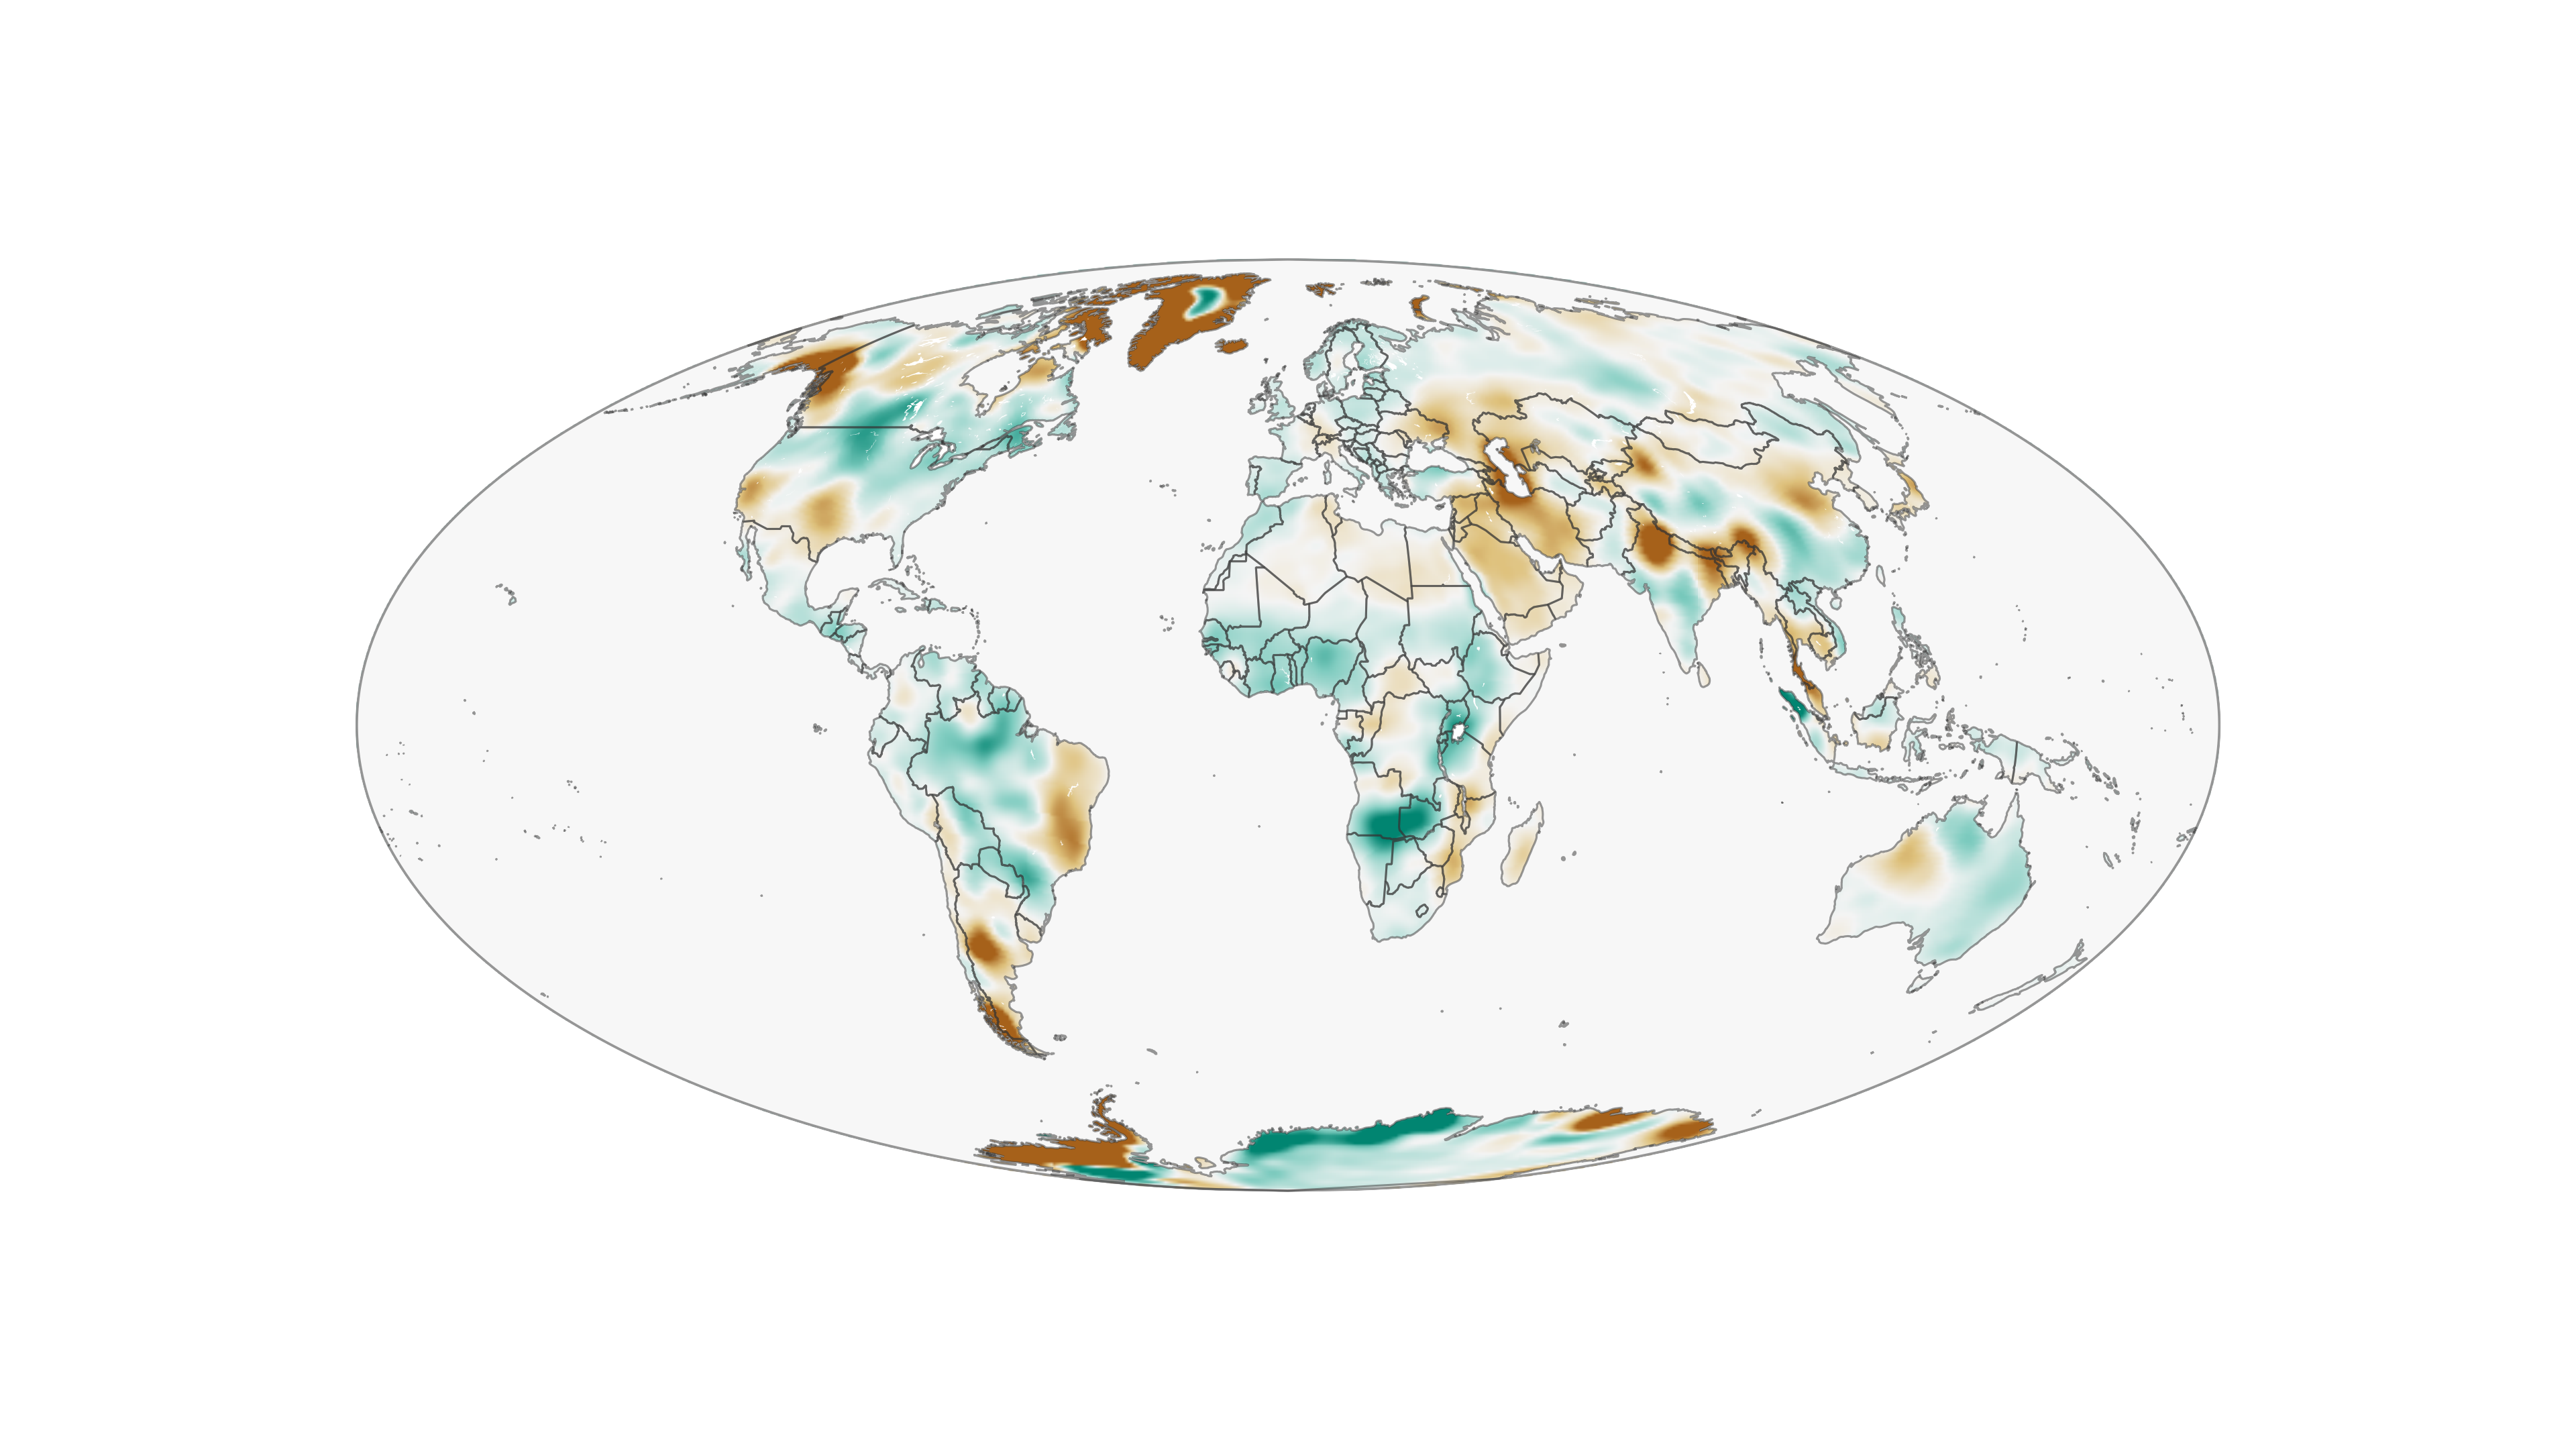
The map above depicts changes in water storage on Earth—on the surface, underground, and locked in ice and snow—between 2002 and 2016. Shades of green represent areas where freshwater levels have increased, while browns depict areas where they have been depleted. Data were collected by the GRACE mission, which precisely measured the distance between twin spacecraft as they responded to changes in Earth's gravity field. In sensing the subtle movements of mass around the planet, the satellites could decipher monthly variations in terrestrial water storage. The GRACE mission officially ended in October 2017, and its successor—GRACE Follow-On, a joint mission with the German Research Centre for Geosciences (GFZ)—was launched from Vandenberg Air Force Base (California) on May 22, 2018.
Freshwater is found in lakes, rivers, soil, snow, groundwater, and ice. Freshwater loss from the ice sheets at the poles—attributed to climate change—has implications for sea level rise. On land, freshwater is a critical resource for drinking water and agriculture. While water supplies in some regions are relatively stable, other regions experienced increases or decreases.
“What we are witnessing is major hydrologic change,” said co-author Jay Famiglietti of NASA’s Jet Propulsion Laboratory. “We see a distinctive pattern of the wet land areas of the world getting wetter—those are the high latitudes and the tropics—and the dry areas in between getting dryer. Embedded within the dry areas, we see multiple hot spots resulting from groundwater depletion.”
Famiglietti noted that while some water loss, such as melting ice sheets and alpine glaciers, is clearly driven by a warming climate, more time and data are needed to determine the driving forces behind other patterns of freshwater change. “The pattern of wet-getting-wetter, dry-getting-drier during the rest of the 21st century is predicted by the Intergovernmental Panel on Climate Change models,” he said, ”but we’ll need a much longer dataset to be able to definitively say whether climate change is responsible for the emergence of any similar pattern in the GRACE data.”
The GRACE satellite observations provided the macro story of water mass changes on Earth, but Rodell, Famiglietti and colleagues needed other tools to figure out what was causing the specific global and regional trends. For instance, groundwater pumping for agricultural use is a significant contributor to freshwater depletion throughout the world, but groundwater levels are also sensitive to persistent drought or rainy conditions.
Famiglietti noted that such a combination was likely the cause of the significant groundwater depletion observed in California’s Central Valley from 2007 to 2015, when severe drought decreased groundwater replenishment from rain and snowfall at the same time that farmers pumped more water from underground.
Declining freshwater in Saudi Arabia also reflects agricultural pressures. From 2002 to 2016, the region lost 6.1 gigatons per year of stored groundwater. Imagery from Landsat satellites reveals an explosive growth of irrigated farmland across this arid landscape from 1987 to the present, which coincides with the drawdown.
The team also identified large, decade-long trends in terrestrial freshwater storage that do not appear to be directly related to human activities. For example, in Africa’s western Zambezi basin and Okavango Delta, water storage increased at an average rate of 29 gigatons per year from 2002 to 2016. This wet period followed at least two decades of dryness. Rodell believes it was a case of natural variability that occurs over decades in this region of Africa.
NASA Earth Observatory image by Joshua Stevens, using GRACE data courtesy of Matt Rodell/GSFC. Story by Ellen Gray, NASA Earth Science News Team.