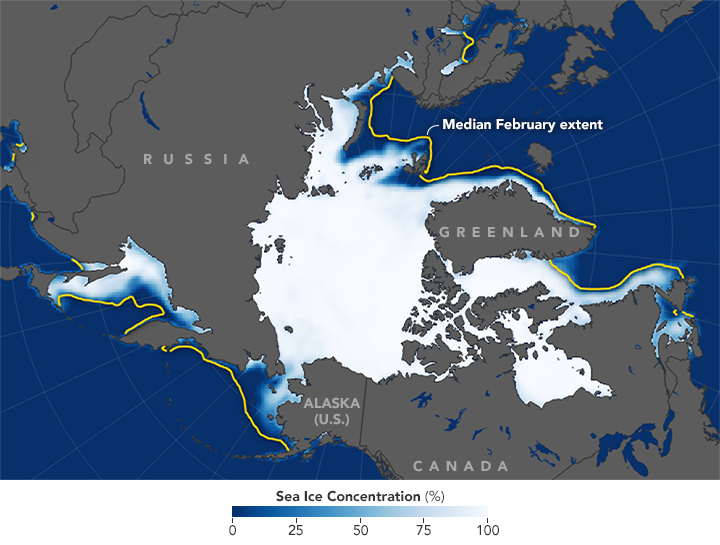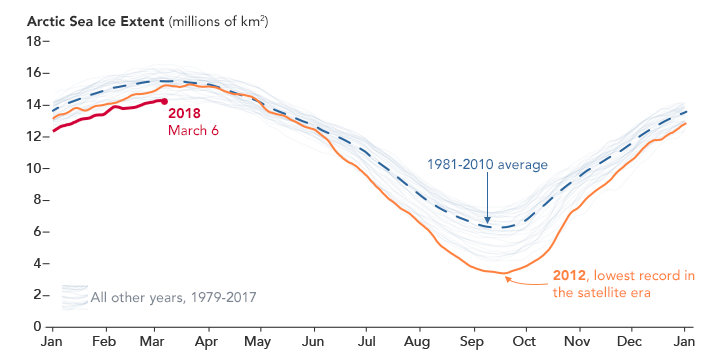


Arctic sea ice reaches its maximum extent each March, following months of growth during usually frigid and dark autumn and winter. The date of maximum extent for winter 2018 has yet to be determined, but in February 2018, the average ice extent was the lowest of any February on record.
The map above shows the average concentration of Arctic sea ice in February 2018. Opaque white areas indicate the greatest concentration, and dark blue areas are open water. All icy areas pictured here had an ice concentration of at least 15 percent (the minimum at which space-based measurements give a reliable measurement), and cover a total area that scientists refer to as the “ice extent.”
The February extent averaged 13.95 million square kilometers (5.39 million square miles), according to the National Snow & Ice Data Center. That is 1.35 million square kilometers below the 1981–2010 average for February. The chart below shows how Arctic sea ice growth this year compares with all years since 1979.

The lackluster ice growth—and the decline in areas such as the Bering and Chukchi seas—was influenced by a so-called “winter warming event.” (Read about the complex chain of events that lead to these events here.) Low pressure off of Greenland and high pressure over Europe helped move warm air masses—and possibly some warm water—from the North Atlantic into the Arctic Ocean. A similar scenario also played out on the Pacific side: low- and high-pressure systems set up in such a way as to move warm air and water from the North Pacific through the Bering Strait.
“We have seen winter warming events before, but they’re becoming more frequent and more intense,” said Alek Petty, a sea ice researcher at NASA’s Goddard Space Flight Center.
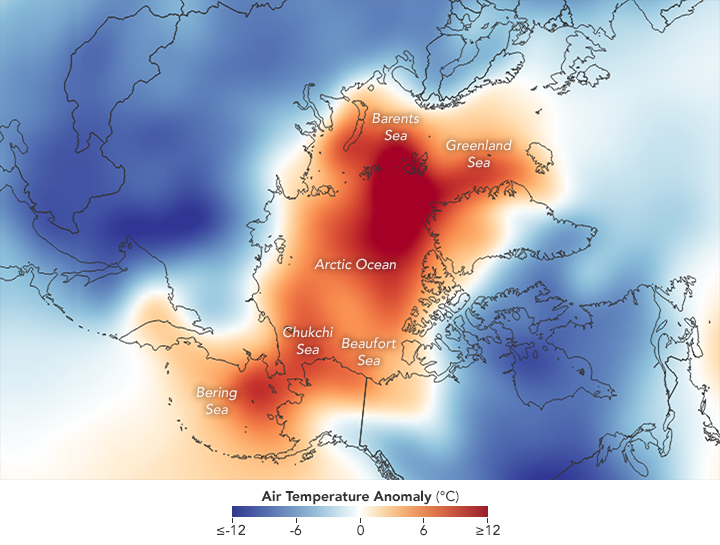
Areas of unusual warmth are visible in the second map, which shows air temperature anomalies for February 2018. Red and orange colors depict areas that were hotter than average; blues were colder than average. At times, the North Pole saw temperatures climb above freezing, soaring 20 to 30 degrees Celsius (36 to 54 degrees Fahrenheit) above the norm.

Notice the area north of Greenland. This is the site of another exceptional event this winter: open water instead of sea ice cover. Without the ice cover here, heat is being released from the ocean to the atmosphere, making the sea ice more vulnerable to further melting.
“This is a region where we have the thickest multi-year sea ice and expect it to not be mobile, to be resilient,” Petty said. “But now this ice is moving pretty quickly, pushed by strong southerly winds and probably affected by the warm temperatures, too.”
NASA’s Operation IceBridge—an airborne mission to map polar ice—will make measurements in the area when annual science flights resume in late March.
NASA Earth Observatory images by Joshua Stevens, using data from the National Snow and Ice Data Center and NCEP reanalysis data provided by the NOAA/OAR/ESRL PSD. Story by Kathryn Hansen with reporting by Maria-José Viñas/NASA’s Earth Science News Team.