The waters off of southwestern Africa are some of the most biologically productive and chemically interesting in the world. They also provide a compelling backdrop for exploring how satellite sensors and creative data processing can reveal important details of the ocean.
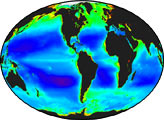
Flowing along the coast of South Africa, Namibia, and Angola, the Benguela Current is the eastern boundary of a large gyre in the South Atlantic Ocean. The current mixes water from the Atlantic and Indian Oceans as they meet off the capes of South Africa. Thanks to this current and to prevailing winds out of the southeast, this portion of the Atlantic is an area of ocean upwelling.
Warm surface waters are driven away from the coast, allowing cooler, nutrient-rich waters to rise up from the seafloor. Plumes of hydrogen sulfide sporadically burst from the oxygen-starved depths, a result of bacteria consuming organic material near the bottom and the natural pumping action of upwelling. Air temperatures along the desert coast of southwest Africa are also moderated by the cooler water.
This dynamic wind and water action causes the ocean to teem with life, from plankton to fish to whales. It all starts with phytoplankton, floating plant-like microorganisms that provide the core source of food for marine ecosystems. The phytoplankton find a near-perfect blend of nutrients, water temperatures, and sunlight to fuel massive blooms. They often show themselves to satellites as an abundance of chlorophyll, the green pigment that helps plants convert sunlight to energy.
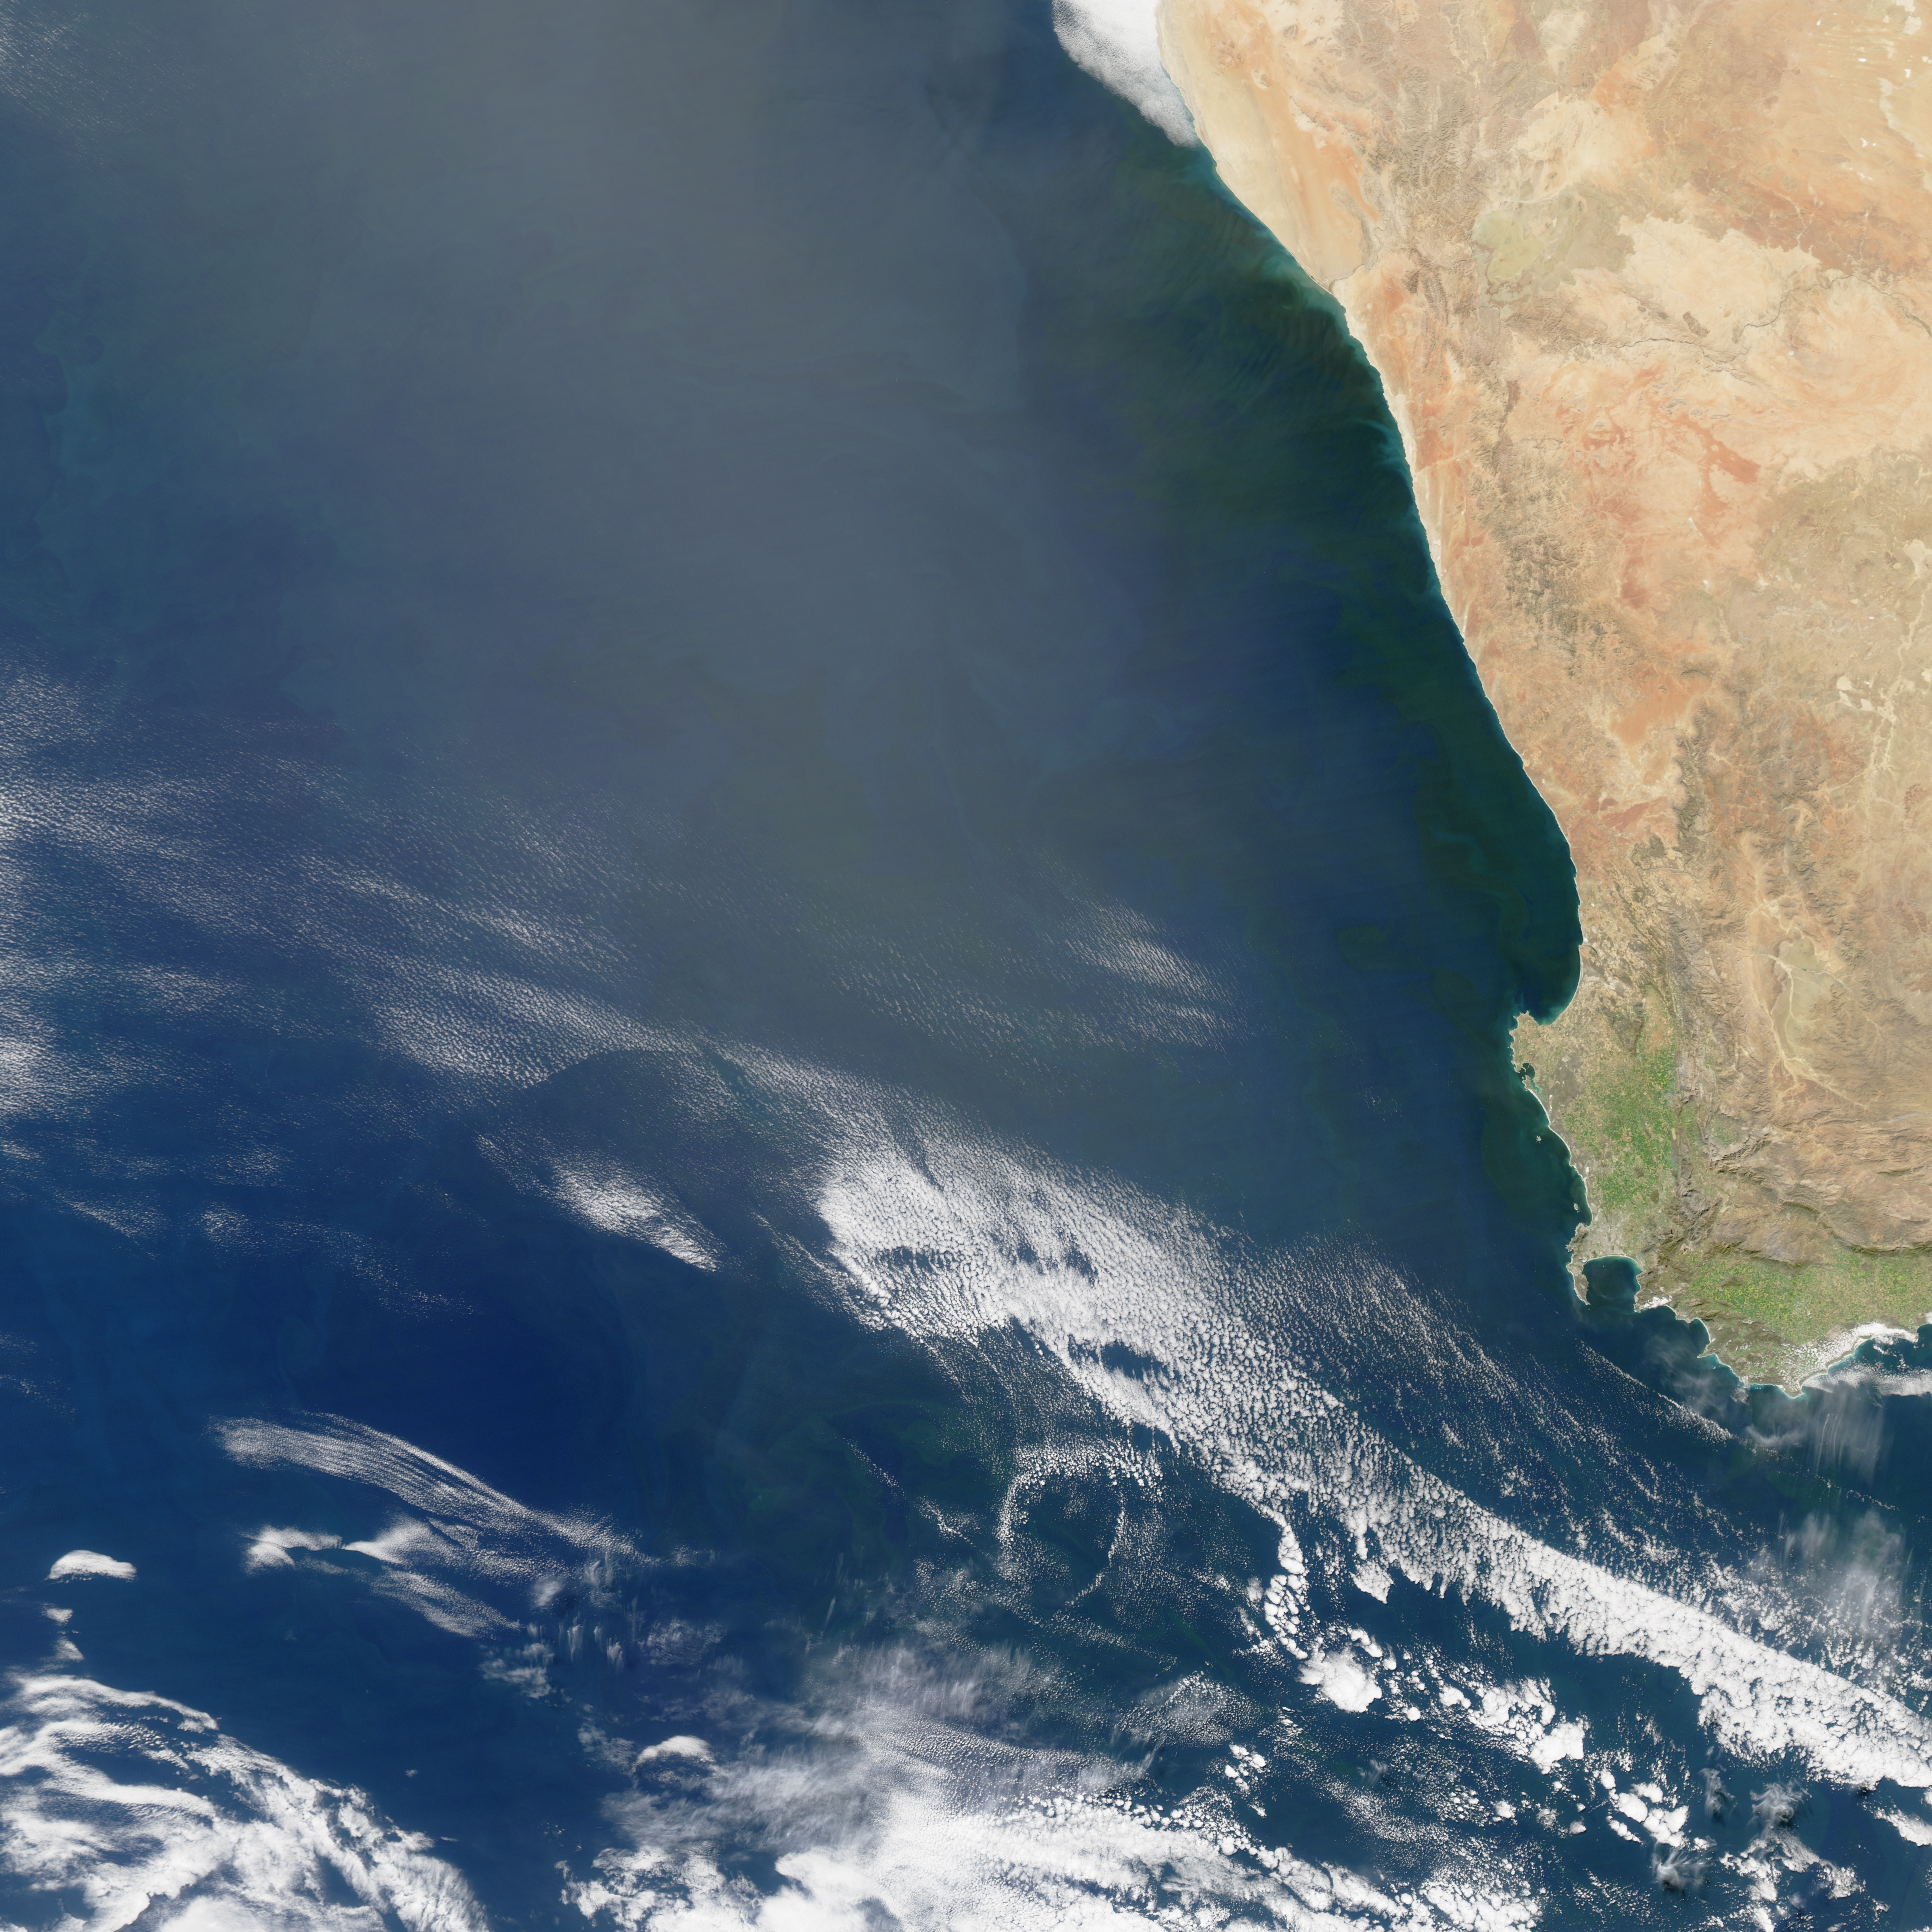
The data for all of the images on this page were acquired by the Moderate Resolution Imaging Spectroradiometer (MODIS) on NASA’s Aqua satellite on September 2, 2017. The sensor observes Earth in 36 different spectral bands; photo-like imagery is most often built from data in the first seven bands.
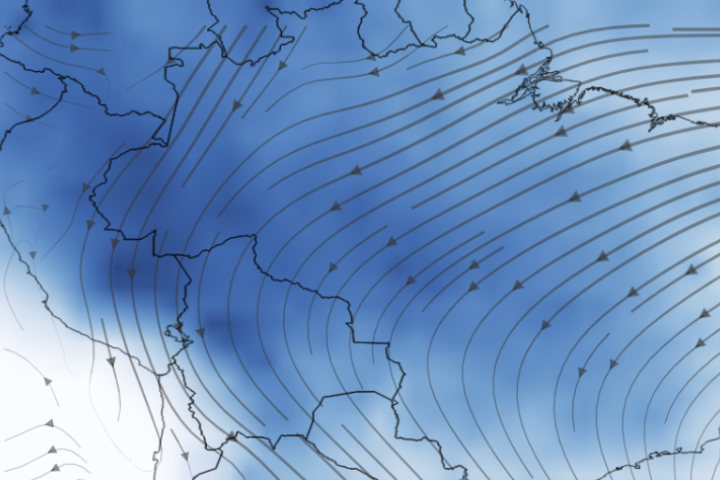
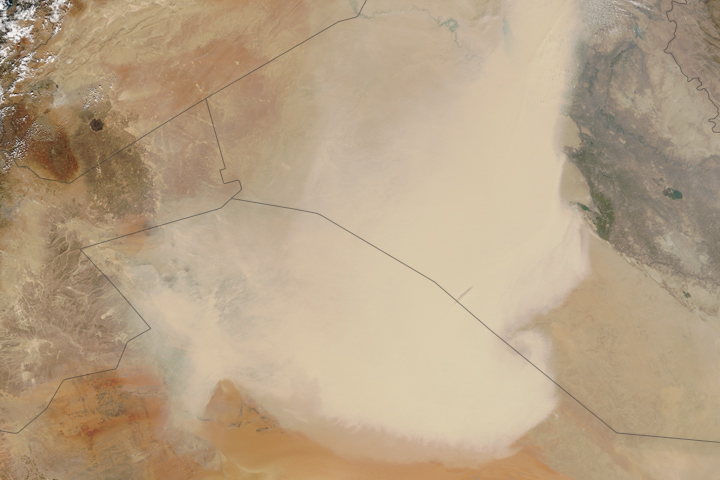
The top image shows the Benguela Current region in natural-color, combining red, green, and blue light (MODIS bands 1-4-3) much as you might see with the human eye. Near the coast, you can see a dark shade of green indicating chlorophyll-rich water. Farther from the coast, the patches of green are harder to detect due to thin clouds and sunglint—the reflection of sunlight back at the MODIS imager (radiometer).
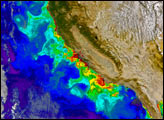
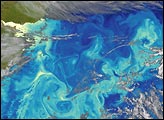
The second image shows concentrations of chlorophyll in the ocean. MODIS instruments have been flying in space since 1999, and other ocean-color detecting instruments have been flying for more than three decades. Over those years, scientists have refined data processing and computer algorithms to better distinguish the light reflected and emitted by chlorophyll from other colors of light detected in the ocean. The result is that it is easier to see the details and hidden abundances of chlorophyll (and therefore, phytoplankton) in the water.
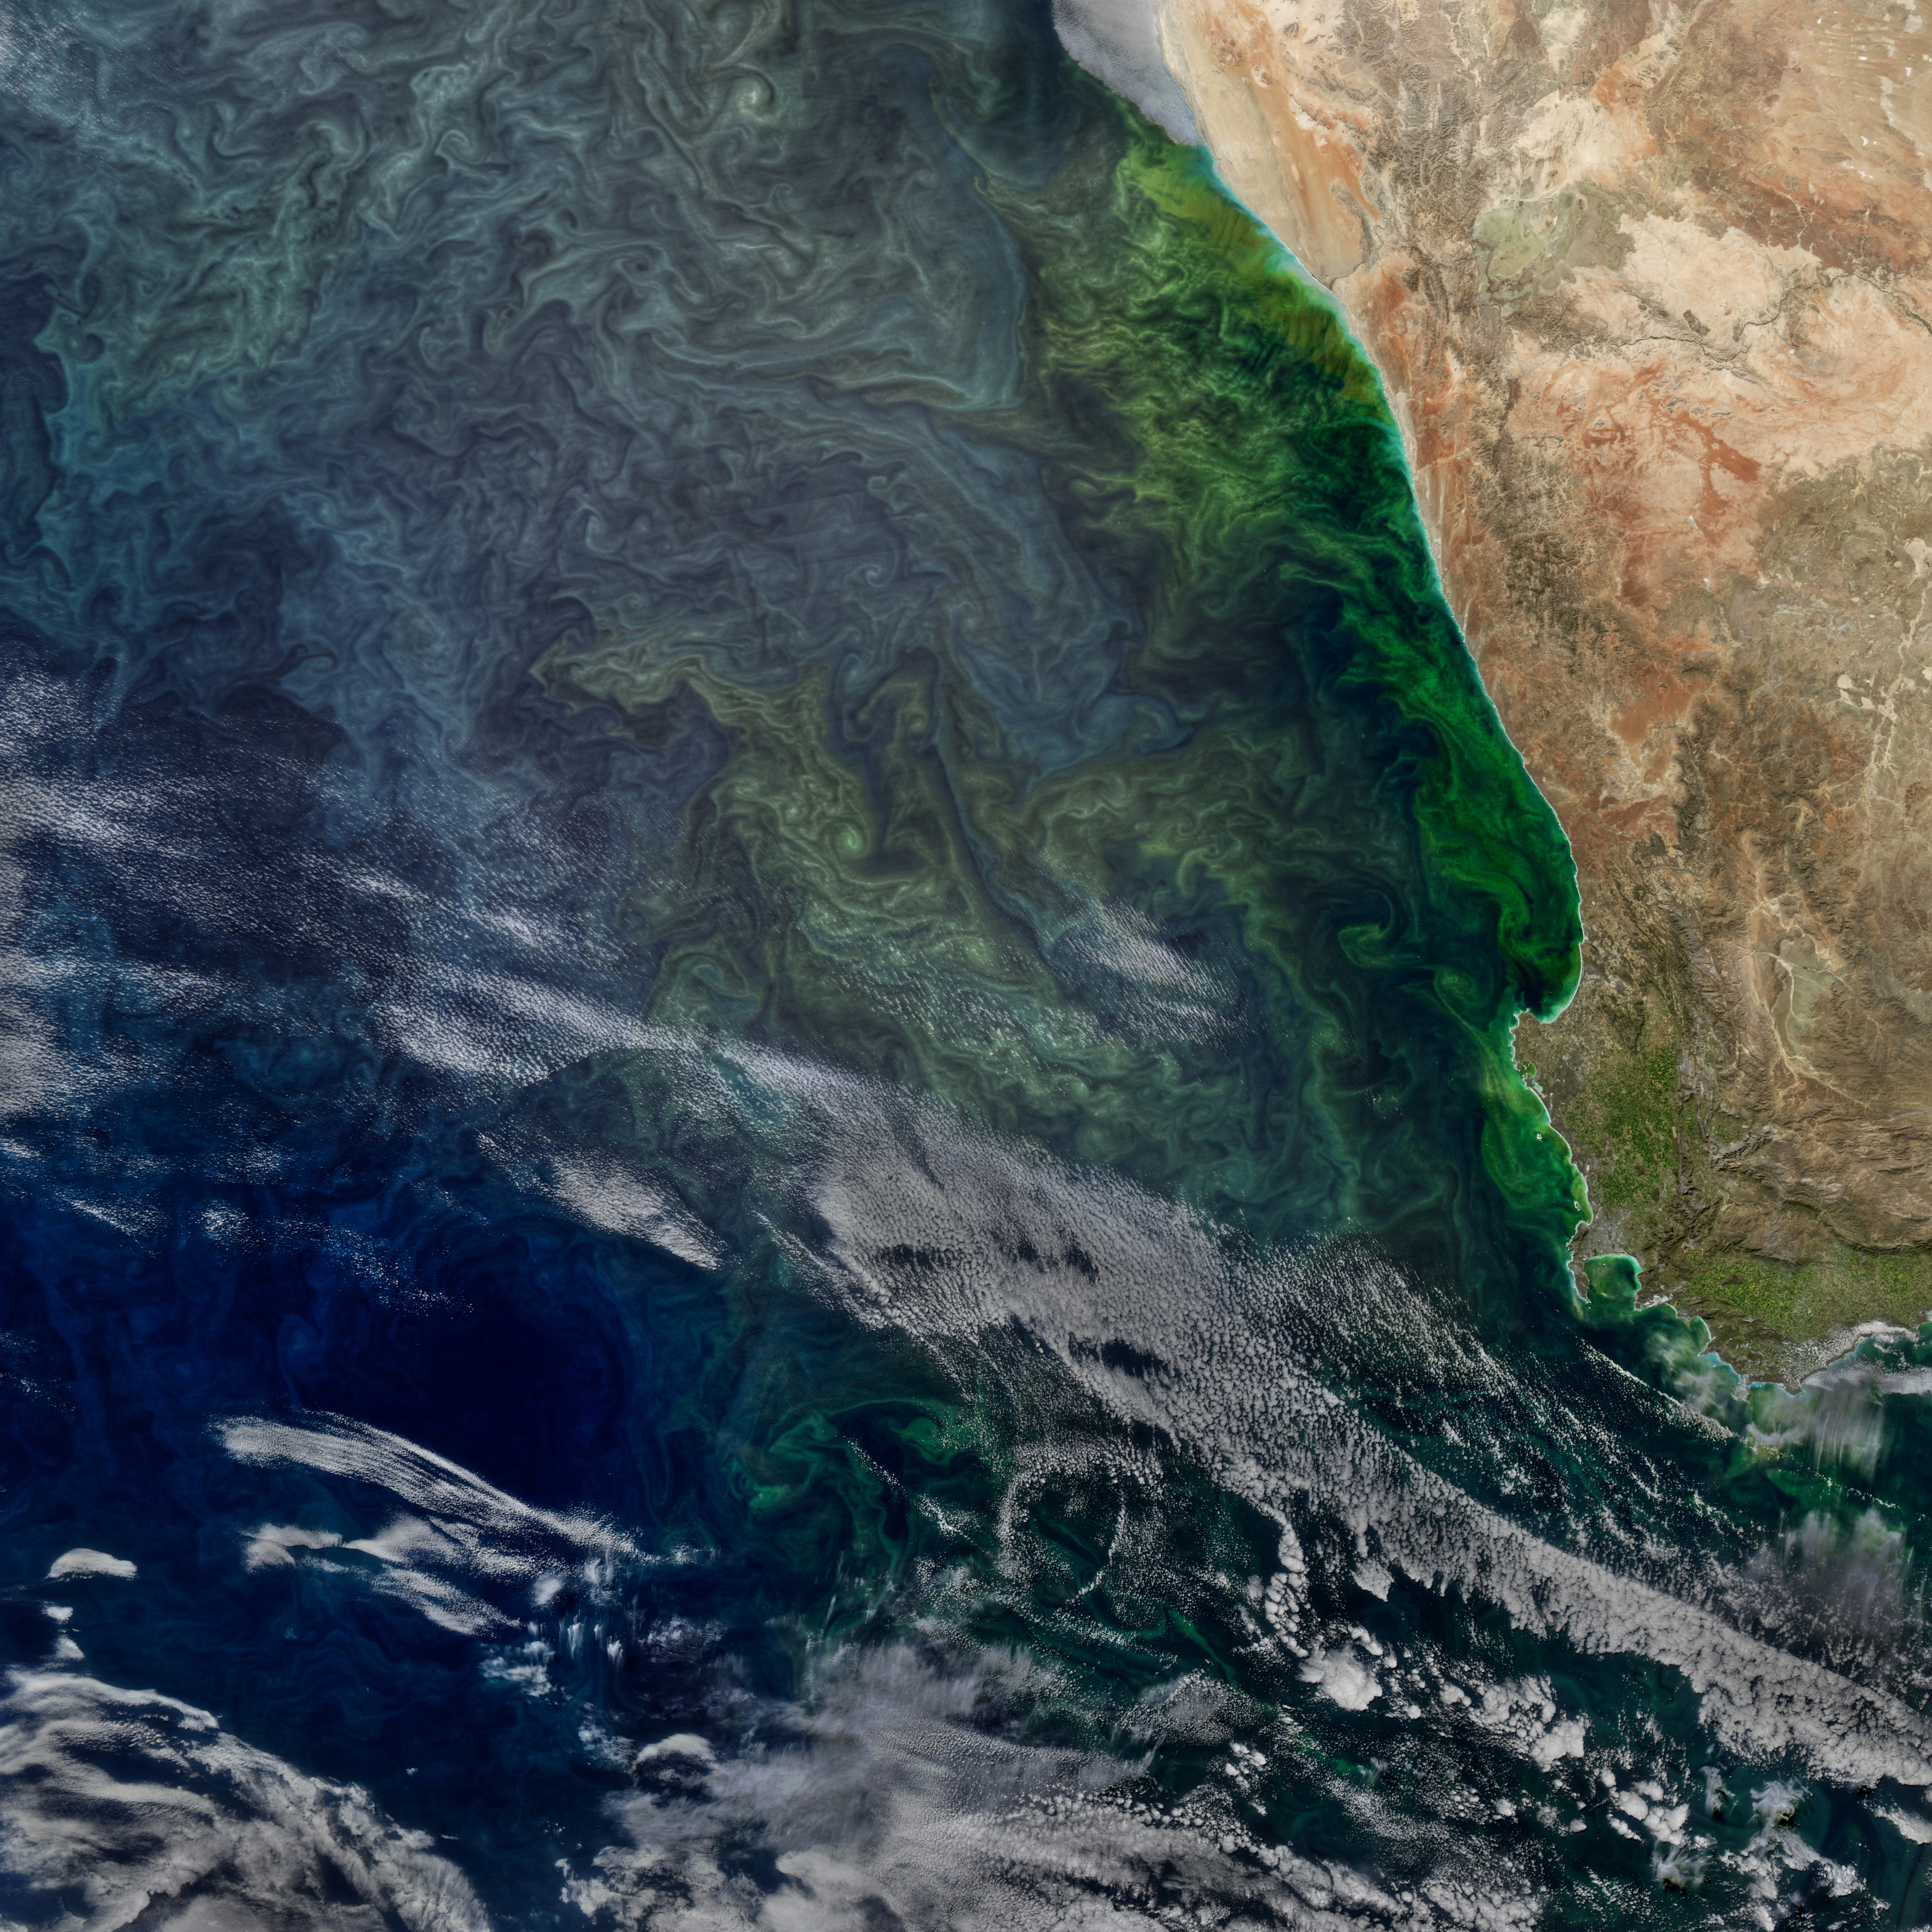
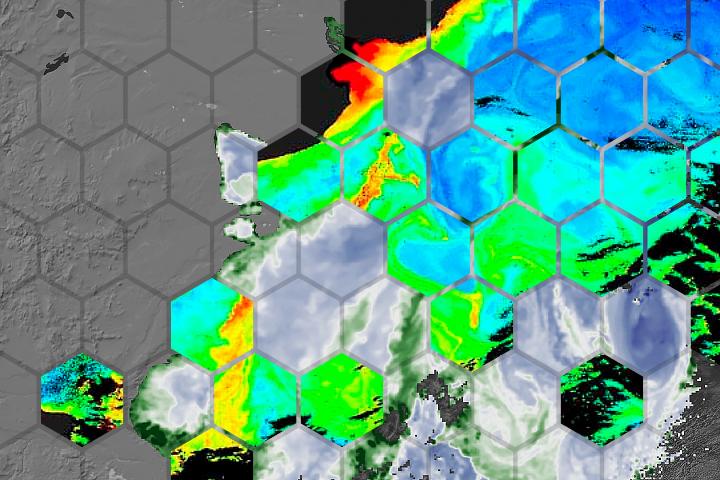
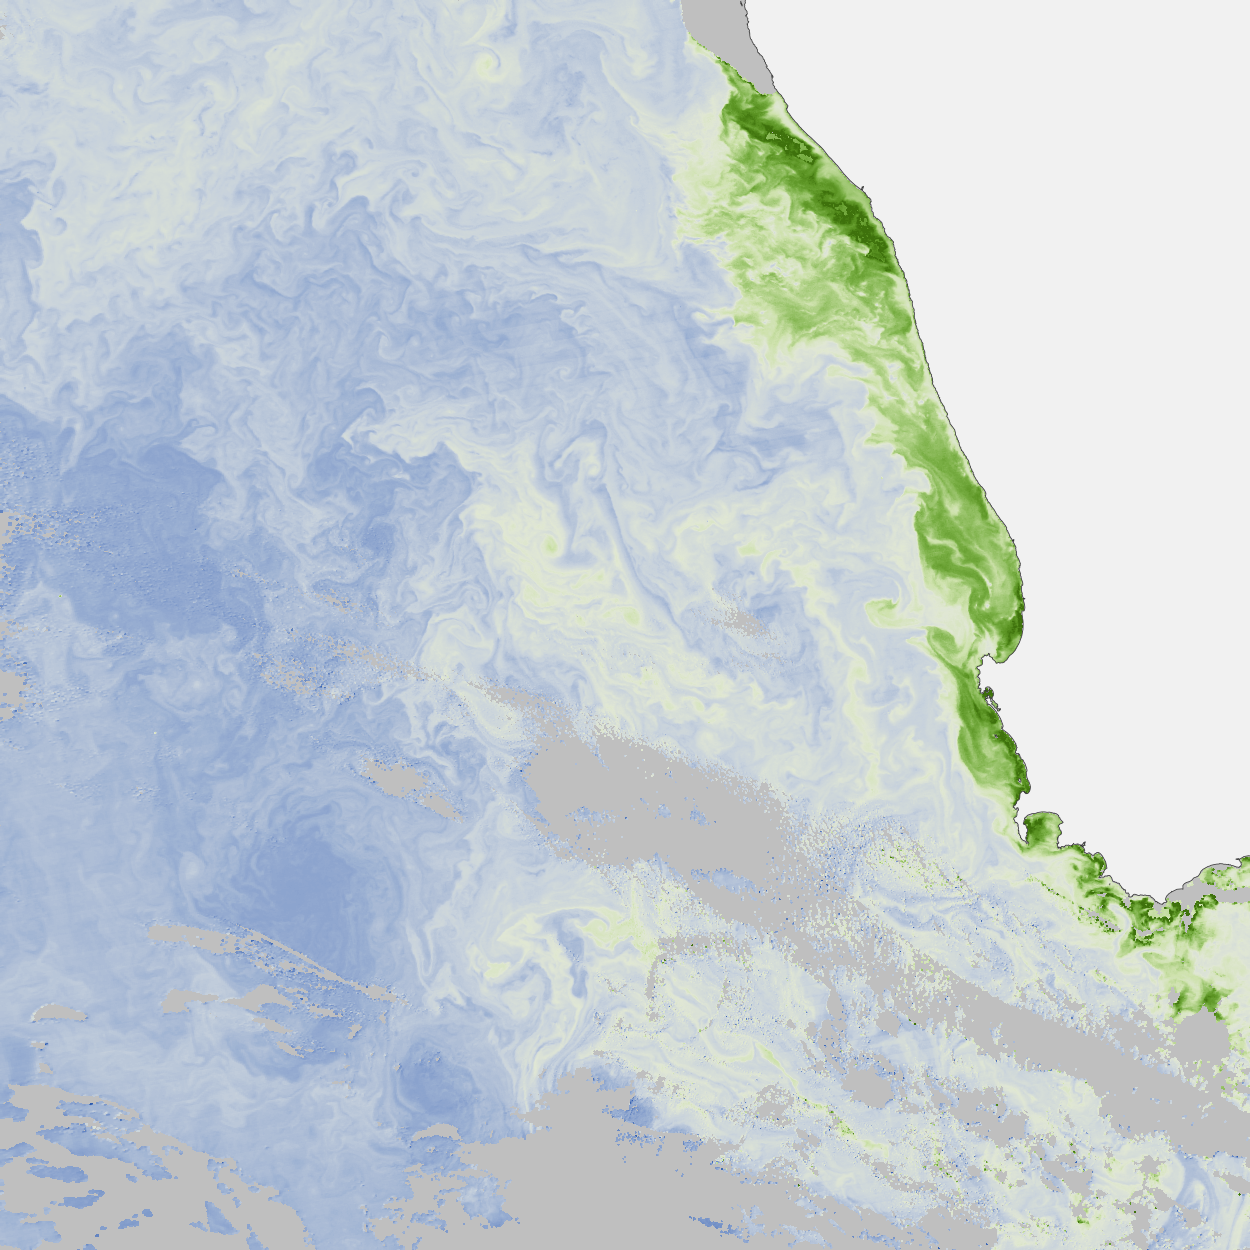
The third image is a blend of art and science. Like a photographer adjusting lighting and using filters, Norman Kuring of NASA’s Ocean Biology group works with various software programs and color-filtering techniques to draw out the fine details in the water. The detailed swirls in the chlorophyll-rich water are all quite real; Kuring simply separates and enhances certain shades and tones in the radiometer data to make the biomass more visible.
“There is some scientific value in this sort of processing in the qualitative sense,” Kuring notes. “For example, I have sent these qualitative, feature-rich images to scientists on research cruises to help them plan their cruise tracks. When sampling the open ocean, researchers often want to drop their instruments into frontal regions where the most interesting phenomena occur. Images like these make such regions more apparent by enhancing gradients.”
“But my main goal in making images like these is to pique the viewer’s interest and, hopefully, make them more curious about the ocean,” Kuring added. “Even folks who have spent their whole lives studying the ocean only know a tiny bit about it. So the more minds that think ‘I wonder why?’ the better.”
NASA Earth Observatory images by Jesse Allen, using data from the Level 1 and Atmospheres Active Distribution System (LAADS), and ocean imagery by Norman Kuring, NASA’s Ocean Color web. Story by Mike Carlowicz.