How Terra Tracks PollutionWildfires and volcanoes aren’t just hazards on the ground. They produce plumes of smoke and gas that can
travel hundreds or even thousands of miles downwind, affecting the chemistry of the atmosphere and impacting the
quality of the air we breathe. Terra carries three instruments designed to observe and measure these plumes. |
|
||
|
|
|||
|
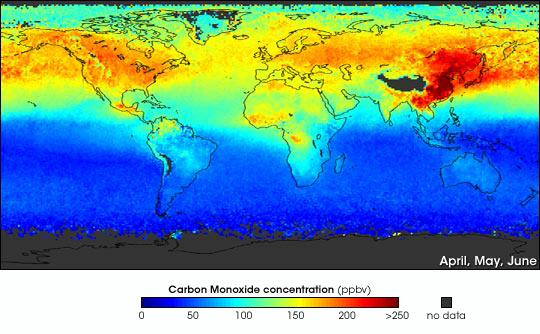
Terra’s Measurements Of Pollution In The Troposphere (MOPITT) instrument provides the first global maps of the concentration of carbon monoxide in Earth’s lower atmosphere. This gaseous pollutant results from fires and human burning of fossil fuel. It is important to monitor carbon monoxide because it is a precursor to the formation of poisonous ozone in the lower atmosphere, and because it shows one way in which humans affect the air we breathe. Thus, Terra’s measurement capabilities allow scientists to distinguish between natural changes in Earth’s environment and changes caused by humans. As such, the mission can help warn of cases when we become hazardous to ourselves. (Please read NASA’s Terra Satellite Tracks Global Pollution for more details.) The U.S. Environmental Protection Agency (EPA) picked up on this fact and began integrating Terra data into its
ongoing efforts to monitor and regulate air quality. EPA scientists found that Terra’s combined precision and
big picture perspective far exceed their ability to measure aerosol and carbon monoxide pollution from individual
locations all across the United States. Now, whenever thick smoke plumes billow from wildfires in western states
all the way to Maine, or whenever industrial smog drifts out of the Midwest and over the Eastern Seaboard, EPA
scientists use Terra data to trace the pollution back to its source as well as predict its future pathways. (Please
read A New IDEA in Air Quality Monitoring for more details.)
|
Colorless, odorless, and poisonous, carbon monoxide (CO) is one of the six major air pollutants regulated in the United States (and by other nations around the world, as well). CO is created when carbon-based fuels, like fossil fuels or wood, don’t burn completely or efficiently. The image above shows the average amounts and geographic sources of CO from April, May and June for the years 2000 through 2004. Blue areas have little or no atmospheric CO, while progressively higher levels are show in green, yellow, orange, and red. (Images courtesy Cathy Clerbaux, NCAR Atmospheric Chemistry Division) More information. | ||
|
What do all these changes in Earth’s environment and climate system say about the health of our home planet? Terra is designed to help scientists answer this question. But, scientists caution, this question is complex and multi-faceted so the answer will not come overnight. |
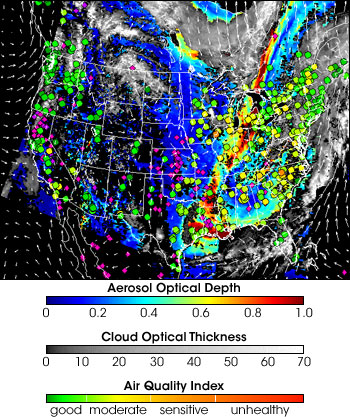
EPA and NASA scientists fuse ground-based measurements with satellite data, meteorological measurements, and computer models to get a big-picture view of air pollution. This data fusion produces a map with several layers of information. The background is satellite data from MODIS, with aerosol optical depth in color (aerosol concentrations increasing from blue to red) and cloud thickness in shades of gray (thickness increasing from gray to white). Wind speed and direction are shown with white arrows, and ground-based measurements of air quality appear as colored dots (air pollution increasing from green to red). Fire locations from the GOES-12 satellite are marked with pink or violet diamonds. The image shows conditions on July 19, 2004. The large area of dense aerosols across the Midwest was caused by widespread fires in Alaska and Canada (see animation). (Map courtesy NASA/EPA/NOAA/CIMSS IDEA program) | ||