In the planet’s highest northern latitudes, even the water in the soil is locked away as ice, making it mostly inaccessible to plants. But just a short distance to the south, in the boreal areas of Alaska, Canada, Siberia, and Scandinavia, the landscape comes alive each year after the spring thaw.
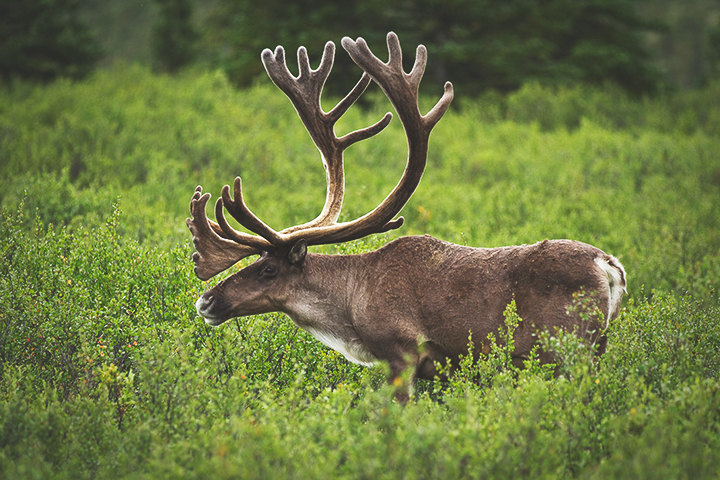
Snow and ice give way to vegetation, signaling the return of the spring thaw—and grazing wildlife. Photo by Jacob W. Frank/NPS.
The transition is relatively rapid, occurring over just a few weeks, and coincides with increasing sunlight and spring snowmelt. Rapid warming releases liquid water. As liquid water becomes more readily available, plant and animal activity are energized. The land greens up, and animals return to graze.
“I’m always impressed by how rapidly northern landscapes transition from frozen and dormant conditions in the winter to a rapid burst of life and activity in the spring,” said John Kimball, a scientist at the University of Montana.
The transition between frozen and thawed land is something researchers have observed for more than 30 years with satellites. The Nimbus-7 Pathfinder, the Defense Meteorological Satellite Program (DMSP) satellites, and Aqua all have carried passive microwave radiometers. They detect the microwave energy coming from the Earth’s surface, which will have different characteristics depending on whether the soil is frozen or thawed. When surface water and soil moisture is locked away as ice, this frozen landscape looks like a desert to a microwave sensor. Thawed landscapes look comparatively wet, so this large contrast is the basis for something called a freeze-thaw measurement.
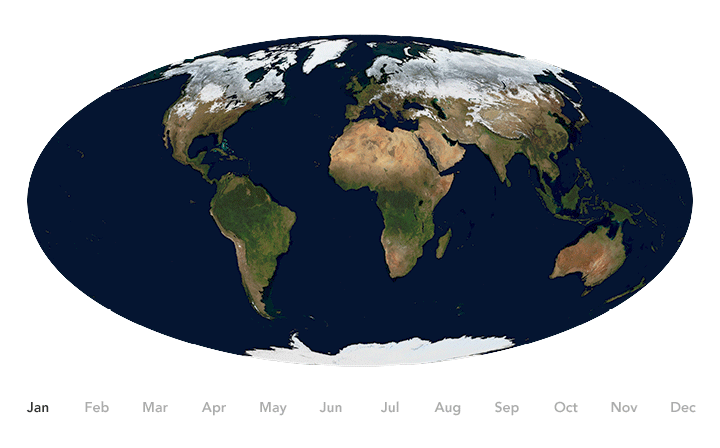
Across a year, the ice and frozen lands advance and retreat in the high northern and southern latitudes. (NASA Earth Observatory image by Joshua Stevens, using NASA's Blue Marble data.)
Kimball and colleagues have mined 30 years of freeze-thaw patterns from the satellite record. In a paper published in 2012, the researchers showed that soils in the Northern Hemisphere thawed for as many as 7.5 days more in 2008 than they did in 1979. The change was primarily driven by an earlier start to the spring thaw and coincided with measureable warming in the region.
“This was a real eye-opener to me,” Kimball said. “We found that the earlier spring-thaw was driving widespread increases in northern growing seasons.” The start and the length of the growing season have implications for how much carbon is exchanged between the land and atmosphere.
Each year, half of all global carbon emissions are removed from the atmosphere by natural processes on the surface. It is sequestered somewhere on land, and a large amount of that carbon is stored at high latitudes. According to scientists at the Woods Hole Research Center, the boreal region covers about 15 percent of the global land surface, yet holds more than 30 percent of all carbon contained on land.
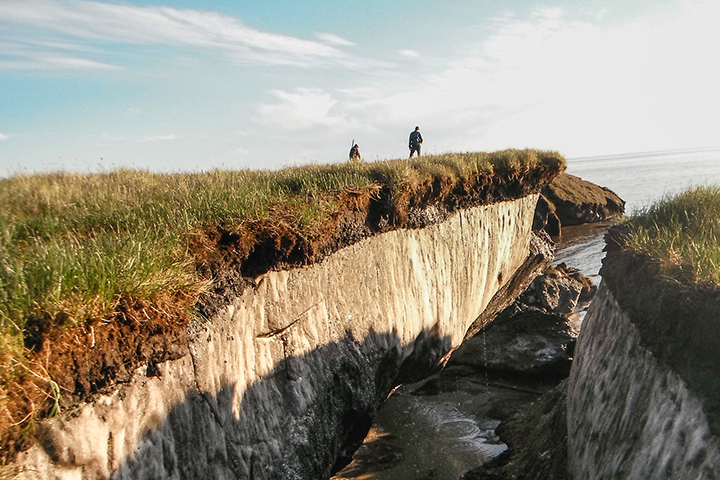
Coastal erosion reveals the extent of ice-rich permafrost underlying the active layer on the Arctic Coastal Plain in Alaska. (Photo by Brandt Meixell/USGS.)
A longer growing season in the north could make vegetation a more important “sink,” removing carbon dioxide from the atmosphere and storing it in forest biomass, dead organic matter, and the soil. But those boreal lands also could become a carbon source though burning, decay, and thawing soil. Currently, the region is thought by many to be a net sink, absorbing more carbon than it releases. But how might thawing soils affect that balance?
The answer is complicated by the fact that the timing of the thaw can vary dramatically over a small area. Sunlight sweeps over the landscape at a low angle, so areas with even the slightest rolling topography can be cast in either shade or sunlight. South-facing slopes thaw first. And just a few extra weeks of thawing time can have a huge impact on plant growth.
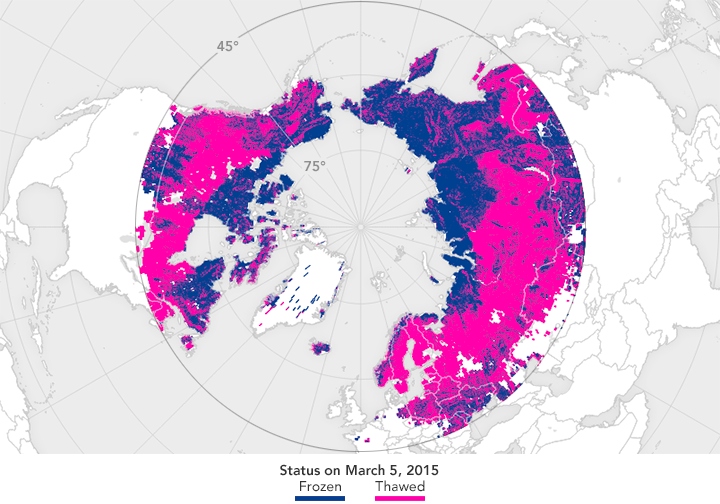
Frozen water forms crystalline structures that can be detected by the radar instrument aboard the SMAP satellite. The map above depicts the freeze-thaw status of areas above 45° N. NASA Earth Observatory map by Joshua Stevens, using data courtesy of JPL and the SMAP science team.
Another complication in the carbon equation is permafrost. Even where the top layer of soil has thawed, there is often a long-term frozen layer below. This frozen layer locks up carbon so that it cannot decompose. But as seasonal thaws reach greater soil depths, more organic matter can decompose and get flushed out into the atmosphere by streams or degassing into the atmosphere. “There is debate as to how stable that soil will be with continued global warming,” Kimball says.
But progress is being made. Freeze-thaw monitoring, according to Kimball, has made a major advance thanks to the development of well-calibrated, long-term satellite soil moisture records. As those observations continue, and as they encompass more of the planet, it stands to reason that our understanding of the entire water cycle will improve.
