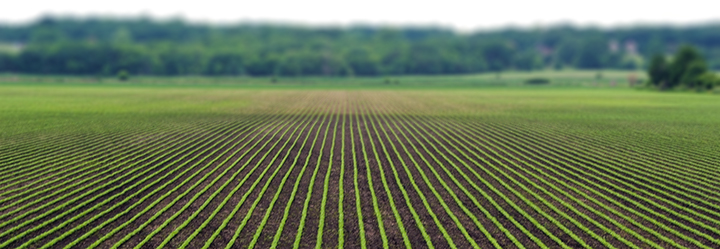
Crops need moisture. But too much rain, or too little, can put crops in jeopardy. (Photo by Carl Wycoff, adapted under a Creative Commons license.)
The most obvious users of soil moisture data are farmers and ranchers. There’s more to it, however, than the simple fact that plants need water to grow. Knowing something about the moisture in the soil is important before, during, and after the growing season. For example, will mud prevent a tractor from safely driving across the fields? How much water will fruits, nuts, and vegetables have available at each stage of growth, from germination through harvest? What is the forecast for crop yields around the world? How will the amount of moisture and agricultural output affect trade policy and food aid?
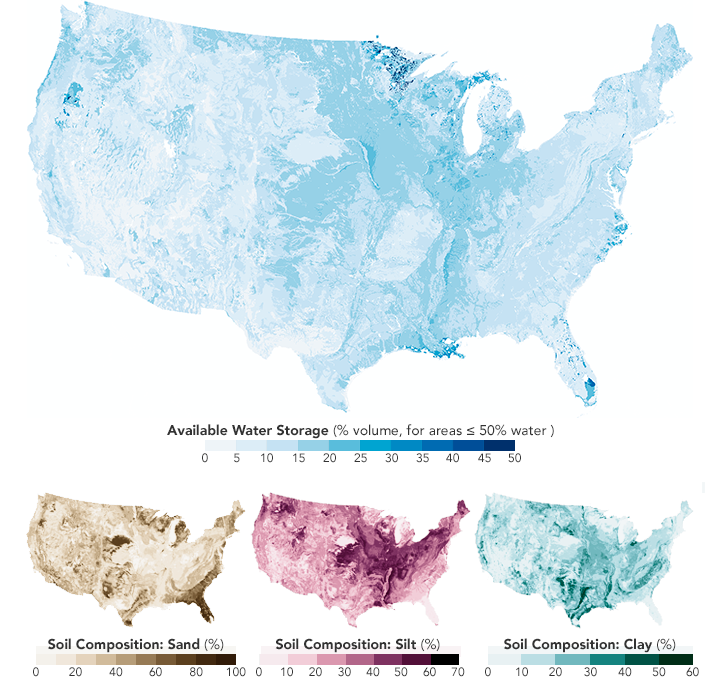
Soils with very small particles, such as clay and silt, are able to hold more water than soils with large particles, like sand and gravel. The composition of soil varies across the United States (above) and around the planet. (NASA Earth Observatory maps by Joshua Stevens, using data from the CONUS-SOIL database.)
Ground-based sensors can monitor soil moisture over small areas, typically less than one square meter. To find out what is happening over larger areas, researchers in several U.S. states have patched together a network of sensors. In Oklahoma, for example, a network to monitor weather and climate parameters (including soil moisture) was conceived after a disastrous flood struck Tulsa in 1984. Interest in this type of network for agricultural purposes also arose in Stillwater. The result was an environmental monitoring network called Mesonet, which in 1996 started to include soil moisture sensors.
Today, more than 100 stations across Oklahoma are making measurements at various soil depths down to 60 centimeters (24 inches). Sensors record the temperature during and after a imparting a pulse of heat; the amount of water in the soil can then be inferred from the temperature change. (Other ground-based methods involve neutron scattering or soil coring.) Data from these sensors, updated every 30 minutes, can help farmers quickly figure out where there is inadequate moisture in their fields.
Mesonet is just one of 31 networks and 1,479 stations in North America. But, in situ networks do not cover all areas of the United States, and certainly not the planet.
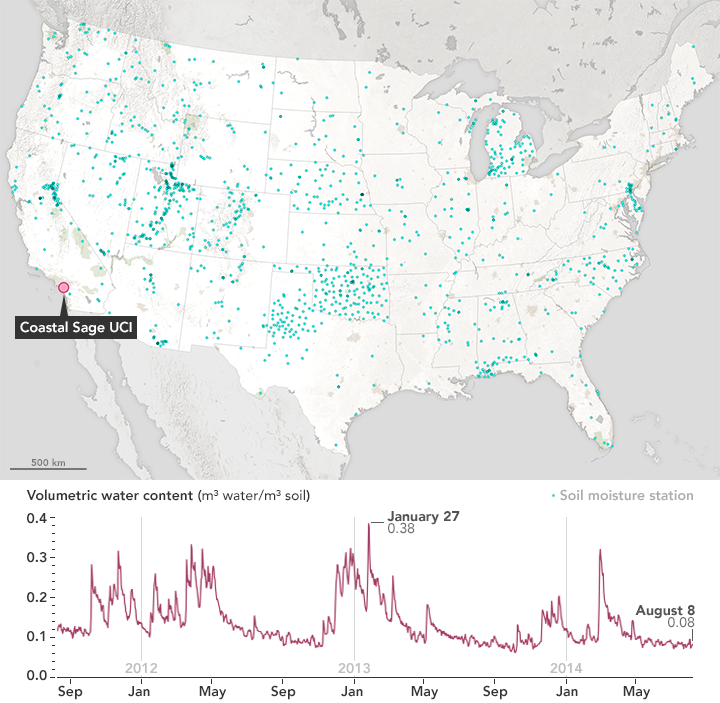
Nearly 1,500 stations track soil moisture in locations across the United States. As an example, the plot shows data from the Coastal Sage UCI station (California). As the map shows, the network is relatively sparse for the size of the nation. (NASA Earth Observatory map and chart by Joshua Stevens, using data from the TAMU North American Soil Moisture Database.)
To fill in the gaps, some scientists estimate global soil moisture by running computer models loaded with precipitation, temperature, and humidity data. Gathering all of the data to run such models can take as long as two to three months, which makes real-time applications impossible.
“What we really want is soil moisture information that can be used to understand how plants are growing and what’s going on in the atmosphere right now,” said Susan Moran, a hydrologist with USDA’s Agricultural Research Service and chair of the SMAP Applications Working Group. “We have to get soil moisture information to the agriculture community, and the only way to do that is from satellites.”
With the recent satellite missions, Moran and colleagues have been learning more about how soil moisture affects plant growth and agricultural productivity, especially during conditions of water shortage and drought. For instance, she notes there have been drier and longer droughts than the one currently parching the western U.S., but none that have been so hot. The combination of heat and the lack of water is driving soil moisture to unprecedented deficits.
“Data from SMAP will make a giant difference for my work,” she said. “We have already looked at five years of data from SMOS; add SMAP onto that and we begin to get a good time series of global soil moisture to help us figure out where vegetation has a high risk of mortality.”
