
Color the Bay Green (for Chlorophyll) |
|||
Through the Chesapeake Bay “health bulletins” that appeared in the local news, Acker knew that the Bay had experienced low phytoplankton productivity in 2002 and high productivity in 2003. Acker wondered if it would be possible to use Giovanni to detect these changes in chlorophyll concentration. He also wondered if the changes in chlorophyll would be detectable not only near the mouth of the rivers where the nitrogen and other excess nutrients were flowing in, but also farther away at the mouth of the Bay where it opened into the Atlantic Ocean. |
|||
 | |||
“In other areas where rivers have high nitrogen levels,” explains Acker, “dead zones occur adjacent to the river outlet. The most famous example is the large dead zone that occurs in the Gulf of Mexico near the mouth of the Mississippi River each spring and summer.” But chlorophyll observations are more accurate in the open ocean than in shallow water like the Chesapeake Bay, which contains many things that can interfere with the detection of chlorophyll, including sediment, organic material, and even the bottom of Bay itself. In addition, summertime haze caused by air pollution and water vapor is worse closer to land. The haze interferes with satellite observations of the water. In other words, the very place where the Chesapeake dead zone occurs is also the most challenging area for satellites to monitor. If Acker could detect phytoplankton changes farther from the river mouth, he could have more confidence in the accuracy of the results. So Acker decided to use Giovanni to examine the variation of chlorophyll concentration in a study area at the Bay mouth, just east of the Chesapeake Bay Bridge-Tunnel. |
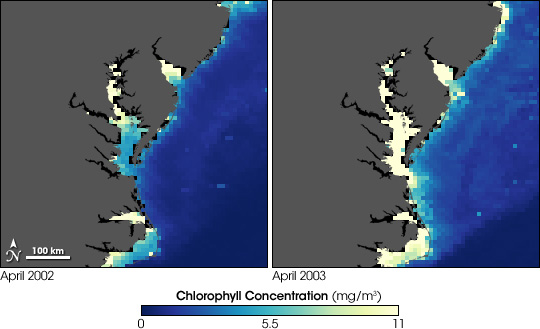
Chlorophyll concentration (a measure of microscopic marine plant life) in the Chesapeake Bay was much greater in April 2003 (right) than April 2002 (left). Jim Acker discovered the difference using NASA satellite data and the Web-based analysis software Giovanni. In these images, low concentrations of chlorophyll are dark blue, while high concentrations are bright yellow. The data are from the Sea-viewing Wide Field-of-view Sensor (SeaWiFS). (NASA images by Robert Simmon) | ||
 |
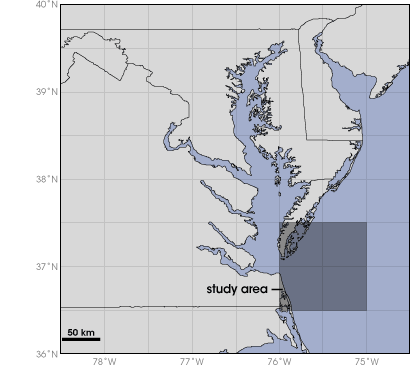
Acker used the Giovanni tool to analyze chlorophyll data at the mouth of the Chesapeake in a study area that extended from 75° to 76° West, and from 36.5° to 27.5° North. He chose a location near the Bay mouth because satellite observations of ocean color are more accurate in open water than in shallow, near-coast waters. (NASA images by Robert Simmon, based on data provided by the GSFC Ocean Color team) | ||
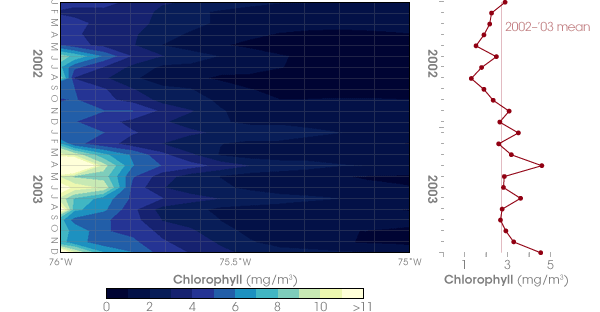
Giovanni Gets to WorkAcker provided Giovanni with the latitude and longitude corners of the study area, and then used Giovanni to calculate monthly average chlorophyll concentration for this area in 2002 and 2003, based on satellite observations from the Sea-viewing Wide Field-of-view Sensor and the Moderate Resolution Imaging Spectroradiometer sensor on NASA’s Aqua satellite. Within minutes, he had his results, and they were both obvious and startling: in every month of 2003, chlorophyll was higher compared to the corresponding month in 2002, and the concentrations in some months were nearly twice as high. Acker had Giovanni plot the variability of chlorophyll with respect to longitude and time. This figure confirmed that chlorophyll at the Chesapeake Bay mouth in 2003 was considerably higher over the entire study area, with the highest concentrations located right where the Bay waters flow into the Atlantic Ocean. |
|||
 | |||
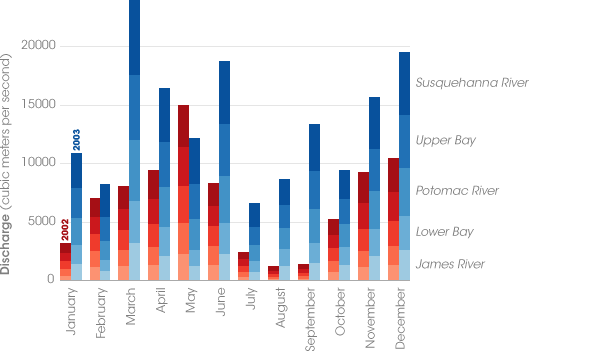
With monthly streamflow data from the U.S. Geological Survey and the Giovanni results in hand, Acker wrote a short paper describing the apparent effect of 2003’s high streamflow on chlorophyll at the Bay mouth. During the 2002 drought, low streamflow caused a much-reduced delivery of nitrogen to Chesapeake Bay. Algae growth (measured through satellite-observed chlorophyll concentrations) declined. In turn, the Bay experienced a temporary improvement in ecosystem health. The nitrogen, however, didn’t disappear—it simply accumulated on the land surface, awaiting heavier rainfall to release it into streams. When the heavy rains of 2003 occurred, much of the nitrogen stored on land surged into the Bay, causing widespread algal blooms and a worse-than-average year for Bay health. |
Chlorophyll levels in the study area were higher in 2003 than 2002. The left-hand graph shows how chlorophyll varied by longitude and time over the course of 2002 and 2003. Degrees longitude appear along the bottom. First letters of months appear along the left side. Chlorophyll levels were highest near the mouth of the Bay (left), where nitrogen was fertilizing the growth of algae. Beginning in March 2003, chlorophyll concentrations jumped dramatically, exceeding 11 milligrams per cubic meter of water in some places. The graph on the right shows the average chlorophyll in the study area. (Figure adapted by Robert Simmon from Acker et. al. 2005) | ||
 | |||
While the basic picture was obvious, the results did raise some questions that Acker, who doesn’t consider himself an expert on Bay biology, couldn’t answer. For example, what did it mean that these changes in chlorophyll concentrations were so obvious at the mouth of the Bay, when the extra nitrogen would have been mostly coming from rivers and streams farther upstream? Acker sent his paper around to Chesapeake Bay experts, hoping for some additional insight into the intricate biological processes that could account for his results. |
The monthly inflow of water into the Chesapeake Bay was consistently higher in 2003 (blue) than 2002 (red). The different segments in each column show the amount of water contributed by major watersheds. The high streamflows of 2003 carried excess nitrogen into the Bay, which fertilized algae that then grew explosively. In turn, the decay of dead algae led to the reduction of oxygen levels in the water, and the development of a large dead zone. (Graph adapted by Robert Simmon from Acker et. al. 2005) | ||