The Forest Returns: 1992 | |||
“Compared to 1920, 1992 was pretty easy,” says Knox. “We had images and land cover data from Landsat,” Steyaert explains. Steyaert and Knox derived their land use intensity, modern-day land cover, and biophysical parameter maps in large part from analysis of the 1992 USGS National Land Cover Dataset, which is based on Landsat satellite data. Since 1972, a series of Landsat satellites have orbited Earth, giving a detailed picture of land cover by recording reflected light and energy and providing an actual measurement of some of the biophysical parameters. For Steyaert, seeing color images of Landsat data captured in 1992 was as easy as walking down the hall from his office at NASA Goddard Space Flight Center. Hanging on the wall was an 8-foot-by-12-foot mural of the United States made from hundreds of Landsat images. “I still go down there and spend time studying the landscape features, literally from coast to coast, comparing my mental and 35 millimeter pictures of places visited with Landsat, and thinking about changes since 1650.” |
|||
 | |||
“Between 1920 and 1992, the forest regenerated,” says Steyaert. “But it’s not the same forest as in 1650. For example, the albedo maps show the relatively low albedos of the darker forest in 1650, higher albedo values with agriculture and landscape fragmentation in 1850, maximum albedos with the intensive land use of 1920, and then intermediate values of albedo in the areas of forest regrowth by 1992.” Canopy height and surface roughness changed, too, with maximum tree height in 1650, minimum heights in 1920, and partial recovery by 1992. |
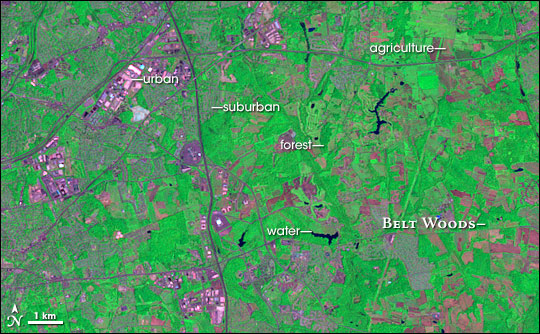
Shades of purple reveal developed land around Old Belt Woods in Maryland. Agricultural land is bright green, and forested land is dark green. The image was captured by the Landsat 5 Thematic Mapper on May 16, 1987. It is made from infrared, near-infrared, and green light. (Image by Robert Simmon, based on Landsat data from the Global Land Cover Facility.) | ||
 | |||
“Altered soil moisture levels in the early growing season as a result of the conversion of various types of wetlands to agriculture by artificial drainage systems represented another important land cover change over time of interest to modelers,” Steyaert adds, pointing out the former areas of seasonally wet prairies within the Upper Midwest and wetlands in the lower Mississippi River Valley. “By 1992, agriculture became much more regional, and much more mechanized and intensive, centered on the Corn Belt and the lower Mississippi River Valley. And of course, there’s been urban growth and fragmentation of the landscape.” “I was somewhat surprised as the study unfolded by the degree to which vegetation in the eastern United States hasn’t recovered,” says Knox. “There is very little forest in the East left that is like the pre-settlement forest, and the degree to which that translated into biophysically important parameters was a surprise.” |
Changes in canopy height—the height of the tallest layer of vegetation growing in an area—dramatically reveal patterns of land use in the eastern United States. In 1650, the eastern United States was largely covered by tall forest. The forest gradually disappeared and was largely gone by 1920. The forest had started to regrow by 1992, but had not reached pre-settlement heights. (Maps by Jesse Allen and Robert Simmon, based on data from Steyaert and Knox.) | ||
