Fields and Forests: 1850 | |||
Sandwiched between “Professions, Occupations, and Trades of the Male Population” and an accounting of livestock and produce during the year ending June 1, 1850, the 1850 agricultural census estimates the acres of “improved” or “unimproved” farmland per county within each state. The scientists classified the rest of the estimated county area as “non-farmland,” but these categories left a lot room for interpretation. To figure out what farmland, unimproved farmland, and non-farmland looked like in each county, Steyaert consulted books and other documents that included historical references dating back 100 years or more in some cases. “Improved farmland basically meant that the land was cleared and used for cultivated crops, pasture, or grassland for hay,” says Steyaert. Farms in highland areas like the Appalachian Mountains would have been different from farms in lowland areas because of differences in elevation, slope, soils, and climate. “Unimproved farmland” could have been an undeveloped frontier claim with the old-growth forest still intact, or a wooded area being used for timber, fuel, or livestock grazing. “Non-farmland” could have meant anything from a village to undisturbed wilderness. How could they decide which scenario was more likely? From the historical information, it became clear that the more populated a county was, the more likely it was that “unimproved farmland” meant a disturbed woodlot and not old-growth forest, and the more likely it was that “non-farmland” meant a village or city and not forest or other natural vegetation. |
|||
 | |||
They decided the best way to map out the fraction of changed and unchanged land in 1850 was to estimate the percent of a county’s land that fell into each of four “land use intensity” categories: highland agriculture and lowland agriculture (based on “farmland” estimates from the census and topographic data), and forest-village disturbance and old-growth forest (based on population density data). These maps revealed how much impact people were having on the landscape in each county and how much area of the pre-colonization land cover classes remained. From there, the scientists could calculate how the climate-relevant characteristics—the biophysical parameters like albedo and surface roughness—had changed as well. The resulting maps showed drastic changes in the landscape between 1650 and 1850. Most of the coastal forest had disappeared. A line of virgin forest traced the peaks of the Appalachian Mountains, and much of the southern forest remained intact. The Upper Midwest was starting its transformation to farm land, though the western frontier, west of the Mississippi, remained relatively untouched. All would be entirely transformed in the era that followed the U.S. Civil War, changes that became evident in the agricultural census of 1920. |
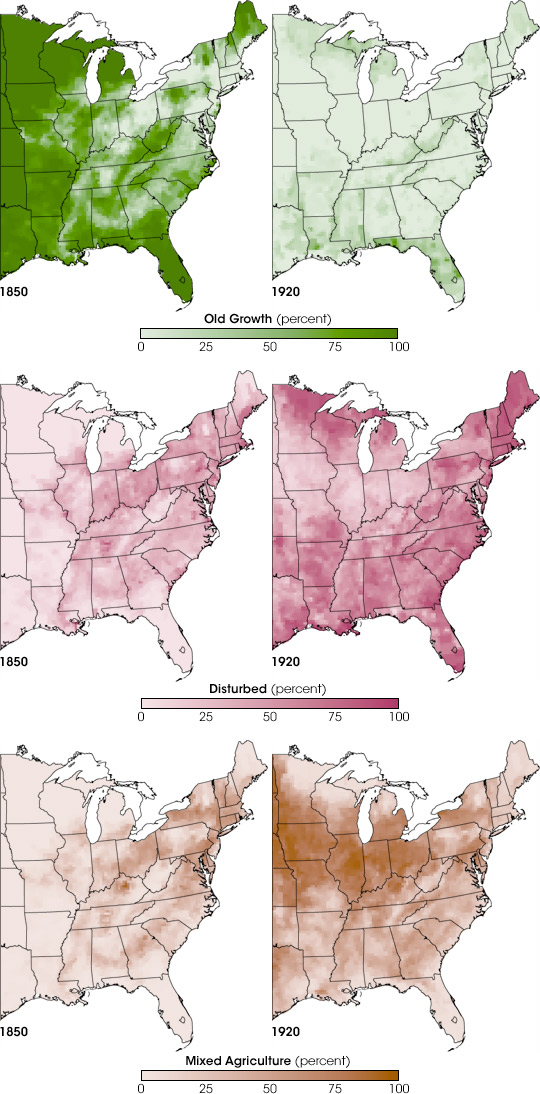
These maps of landscape disturbance describe how settlers were using the land in the eastern half of the United States in 1850 and 1920. In 1850, native vegetation still covered much of the United States except in the Northeast, but by 1920, very little old growth remained. The disturbance maps in the center show how intensively the land was being used, based on the number of people living in each county. The most disturbed areas were more likely to have been cities and intensive agricultural areas. Less disturbed areas were more likely to have been pasture or farm woodlots. The final pair of images illustrates how agriculture intensified and shifted west between 1850 and 1920. (Maps by Jesse Allen and Robert Simmon, based on data from Steyaert and Knox.) | ||
