Greening projects in Lahore could help cool the city as climate change and rapid urbanization intensifies the urban heat island effect.
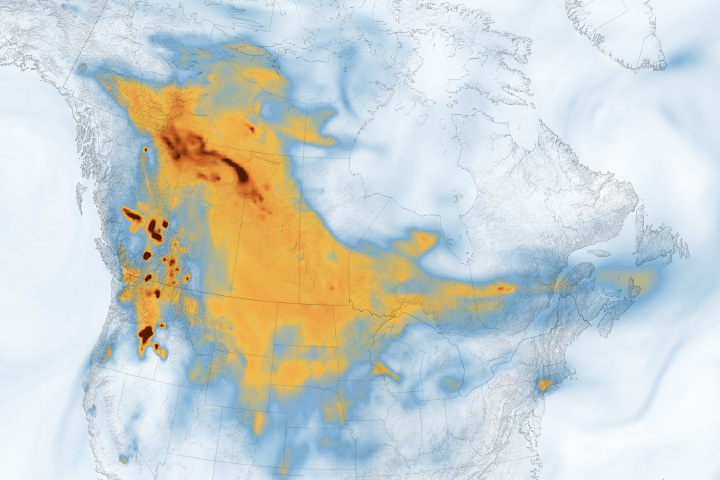
Hundreds of wildland fires lofted sky-dulling smoke over Canada and the United States.
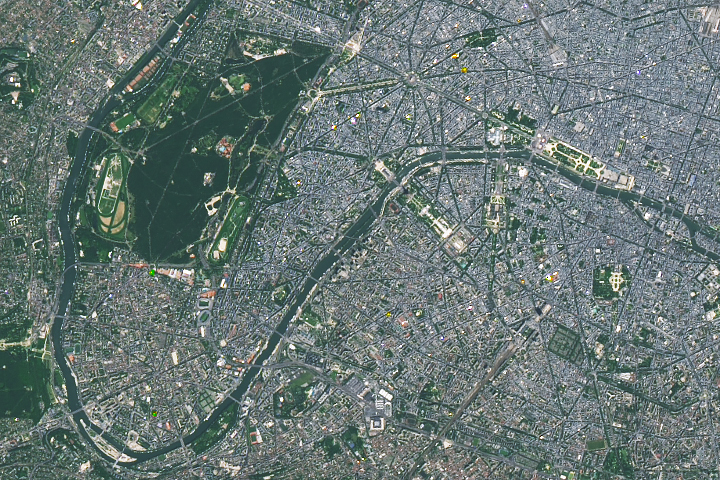
From Paris to Tahiti, the venues of the 2024 Summer Olympics showcase some of France’s iconic landmarks.
Published Jul 25, 2024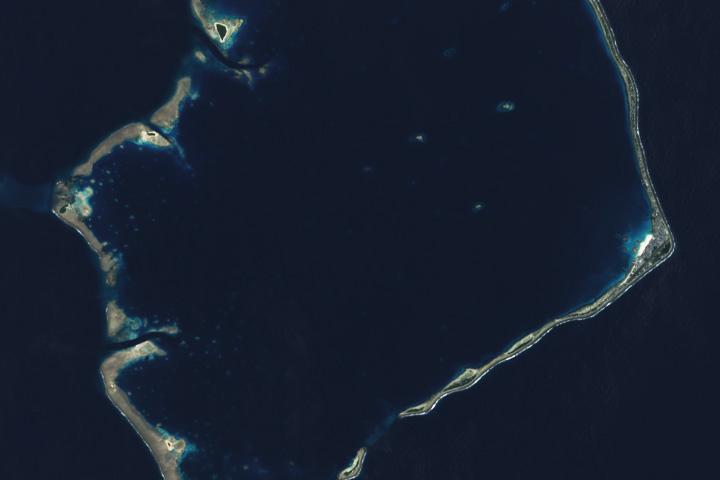
The Pacific island has a storied past in the study of atoll formation and a tenuous future as it adapts to sea level rise.
Published Jul 24, 2024
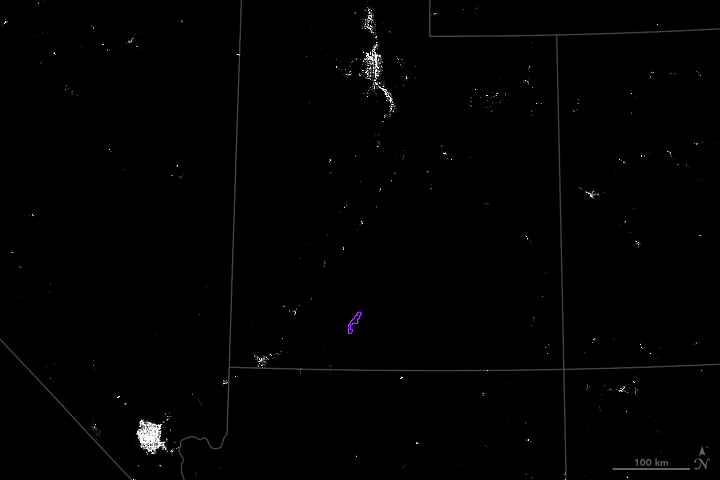
Your challenge is to tell us the location of the satellite image and why it is interesting.
Published Jul 23, 2024
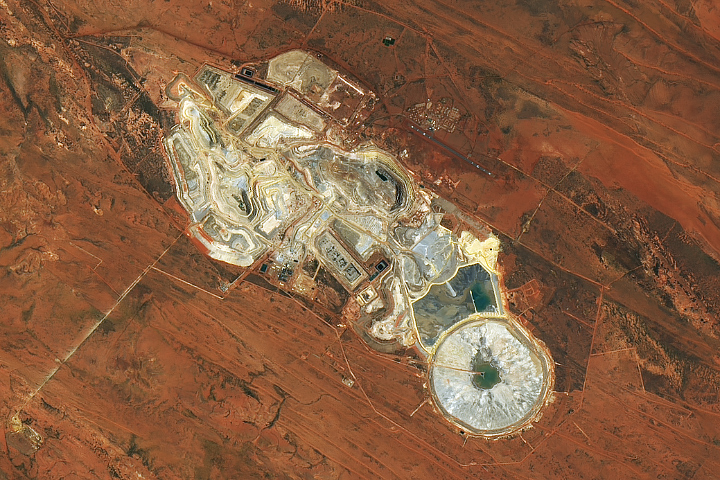
One of the most productive gold mines in Australia lies in the Great Sandy Desert.
Published Jul 23, 2024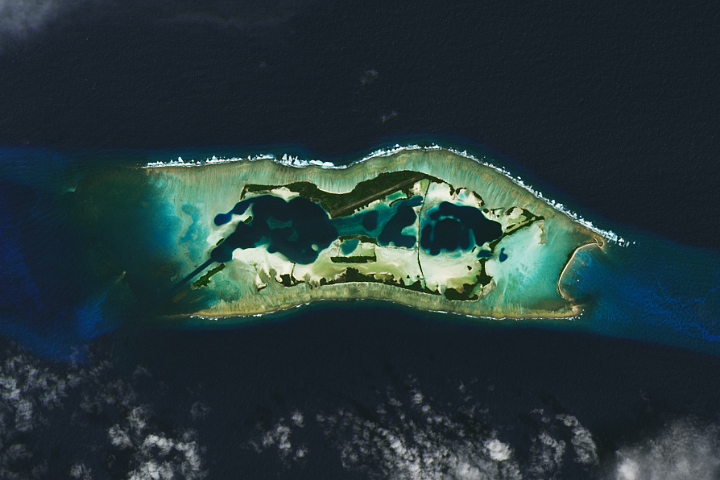
The remote atoll in the tropical Pacific Ocean is a haven for animals of all kinds, though scientists find that some creatures roam beyond protected boundaries.
Published Jul 22, 2024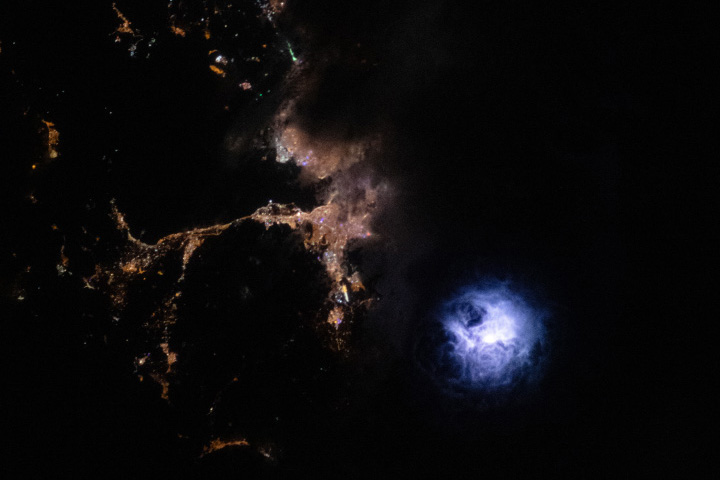
Flashes of light illuminated the textures of cloud tops during a nighttime storm over the region.
Published Jul 21, 2024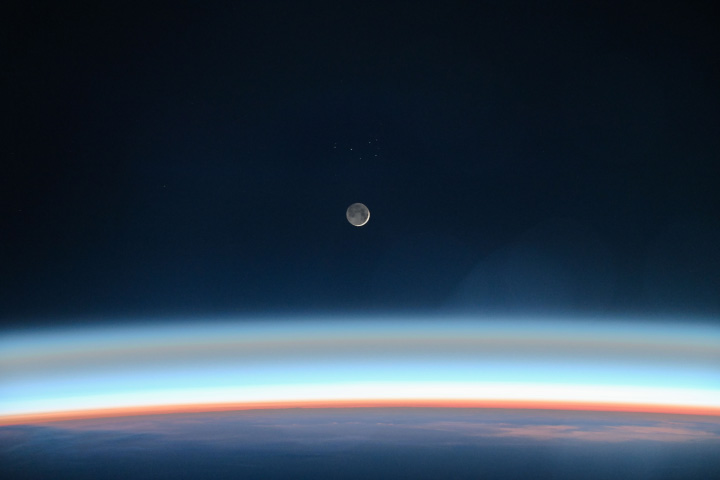
Fifty-five years after our giant leap, scientists continue to learn about both the Moon and Earth from our celestial neighbor.
Published Jul 20, 2024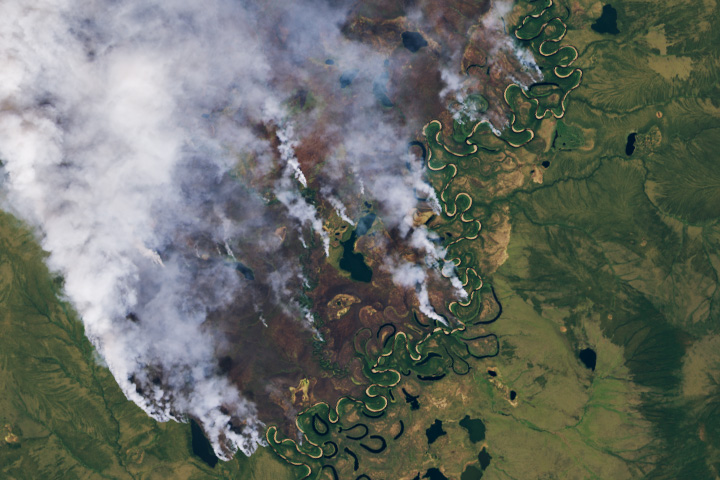
Large wildland fires are burning in the tundra of northern Russia.
Published Jul 18, 2024Have you ever wondered what it would be like to live in a different part of the world? What would the weather be like? What kinds of animals would you see? Which plants live there? By investigating these questions, you are learning about biomes.
Published Aug 28, 2020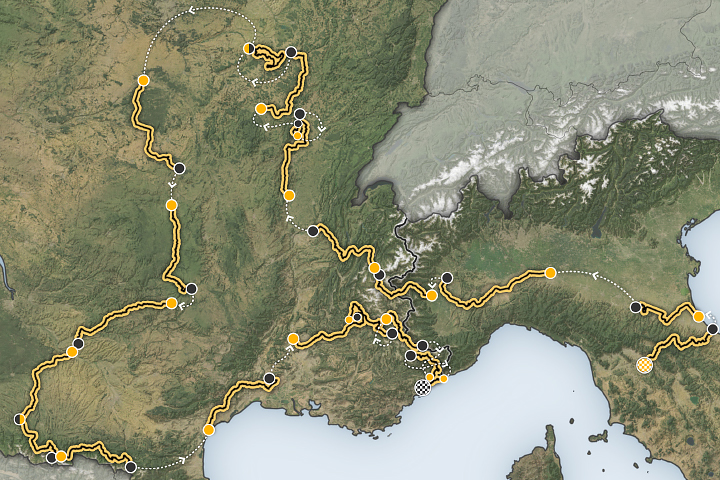
Two of the final stages in the 2024 cycling event traverse high mountain passes in the Western Alps.
Published Jul 18, 2024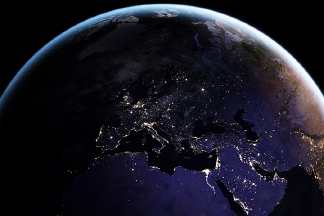
Satellite images of Earth at night have been a curiosity for the public and a tool of fundamental research for at least 25 years. They have provided a broad, beautiful picture, showing how humans have shaped the planet and lit up the darkness.
Published Apr 12, 2017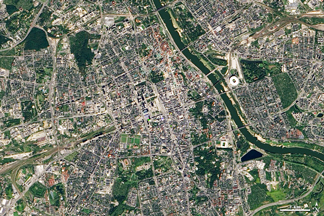
What do you do when presented with a new satellite image? Here's what the Earth Observatory team does to understand the view.
Published Nov 18, 2013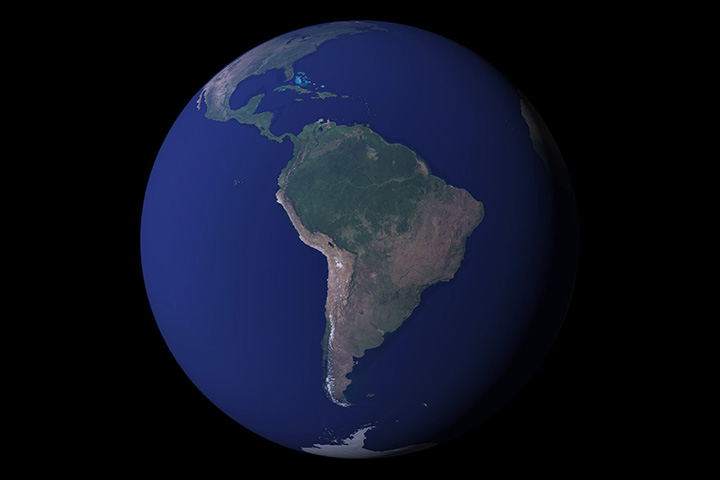
12 months of high-resolution global true color satellite imagery.
Published Oct 13, 2005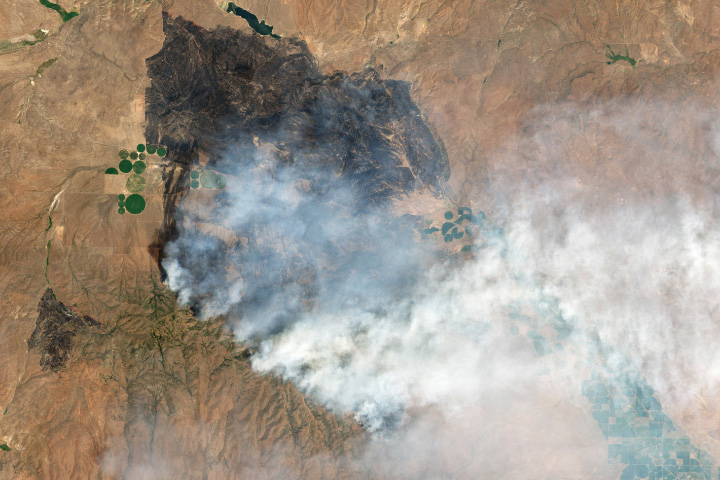
Fast-moving blazes tore through rangeland in the Pacific Northwest amid excessive heat.
Published Jul 15, 2024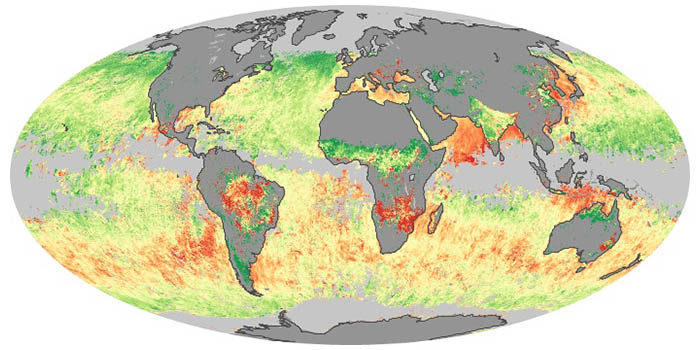
Sea salt, volcanic ash, dust, wildfire smoke, and industrial pollution are types of airborne aerosols. Natural aerosols tend to be larger than human-made aerosols. These maps show when and where aerosols come from nature, humans, or both.
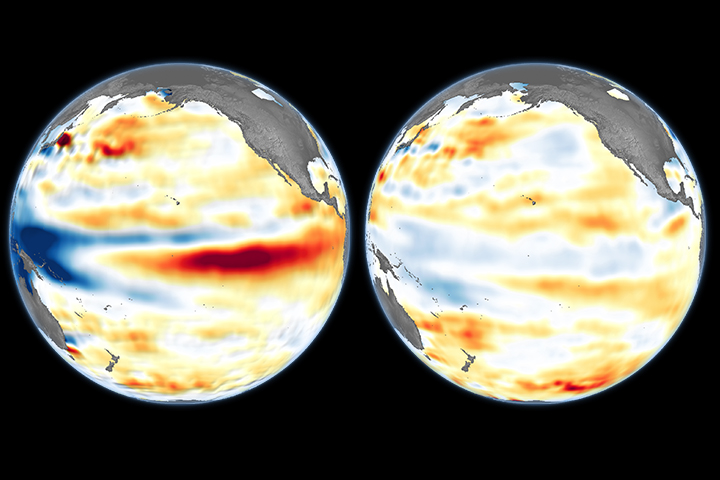
The natural climate phenomenon contributed to upheavals in temperature and rainfall patterns across the globe.
Published Jul 15, 2024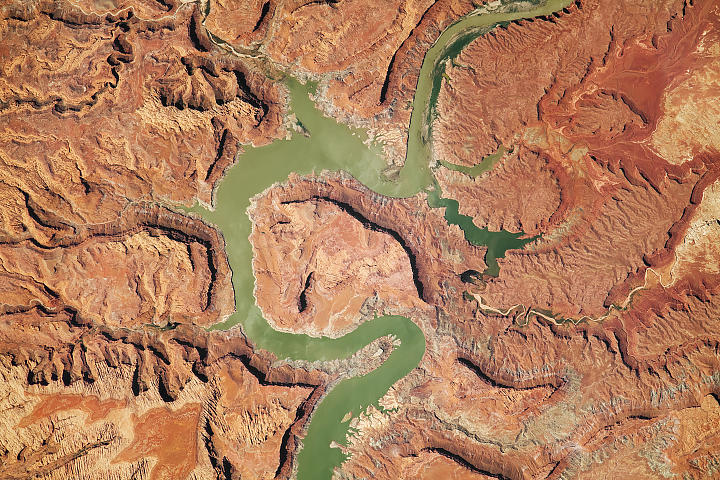
Erosion, tectonic uplift, and a human-built dam have all helped shape the Upper Lake Powell area in Utah.
Published Jul 14, 2024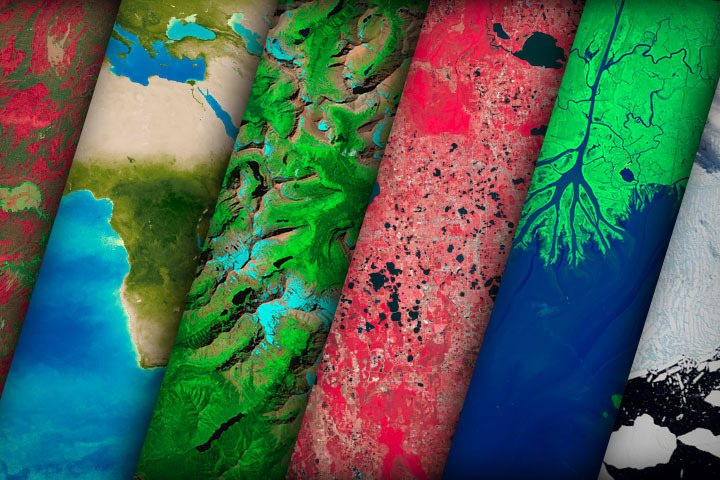
NASA satellites document how our world—forests, oceans, human landscapes, even the Sun—changes over months, seasons, and years.
Published Apr 29, 2009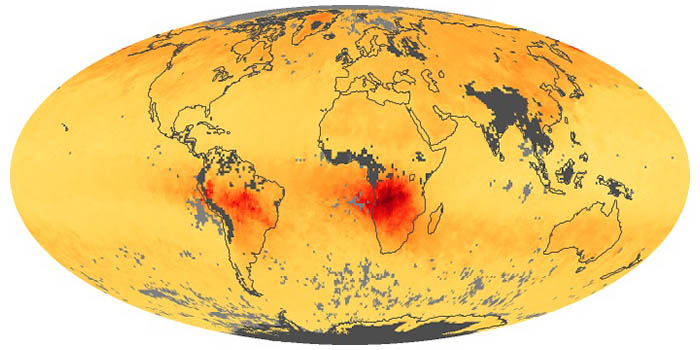
When fuels such as coal, wood, and oil burn incompletely, they produce carbon monoxide. The gas is spread by winds and circulation. These maps show monthly averages of CO in the lower atmosphere.
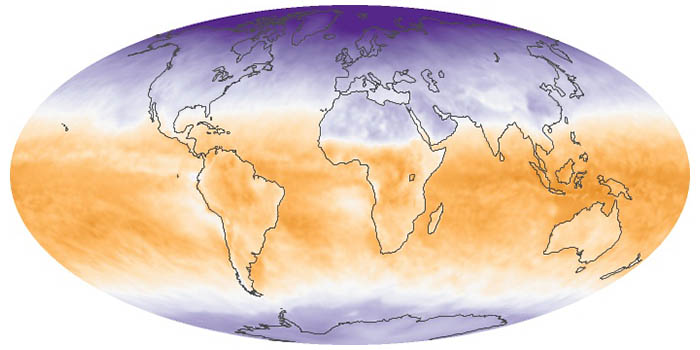
Net radiation is the balance between incoming and outgoing energy at the top of the atmosphere. It is the total energy available to influence climate after light and heat are reflected, absorbed, or emitted by clouds and land.
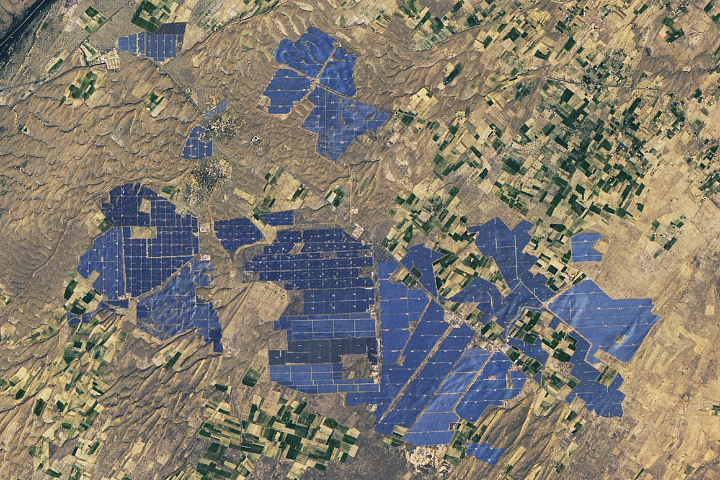
People have developed systems to harvest and store energy from sources such as wind, sunlight, and tidal action. Many of these installations are visible from orbit.
Published May 10, 2024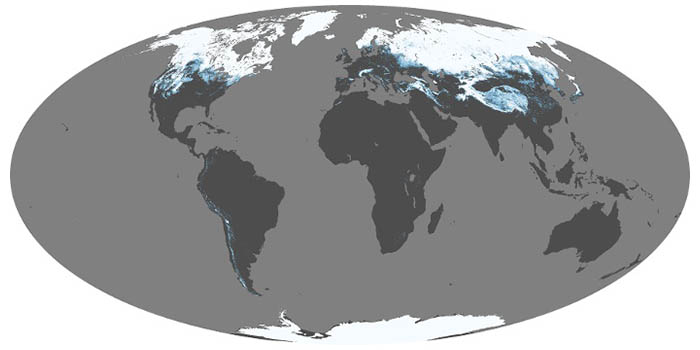
Snow and ice influence climate by reflecting sunlight back into space. When it melts, snow is a source of water for drinking and vegetation; too much snowmelt can lead to floods. These maps show average snow cover by month.
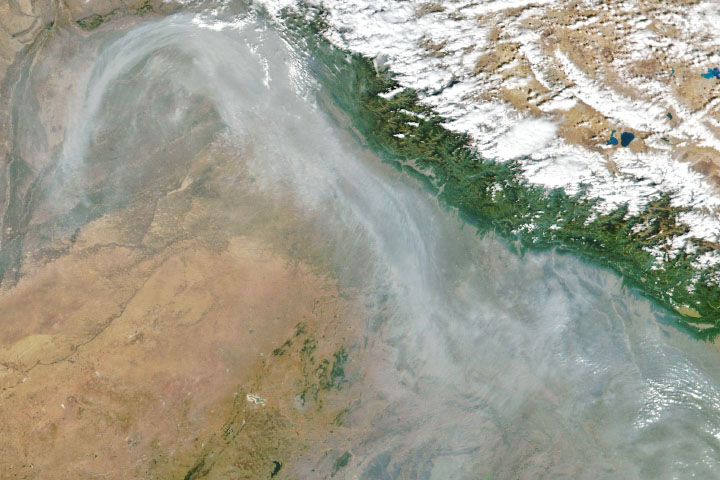
From ground-level ozone to particulate matter to nitrogen dioxide, an array of gasses and particles can affect the air people breathe, with implications for human health.
Published Apr 8, 2024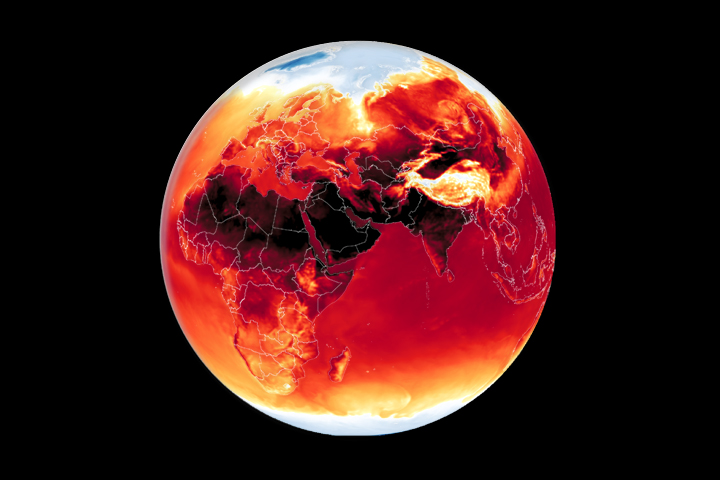
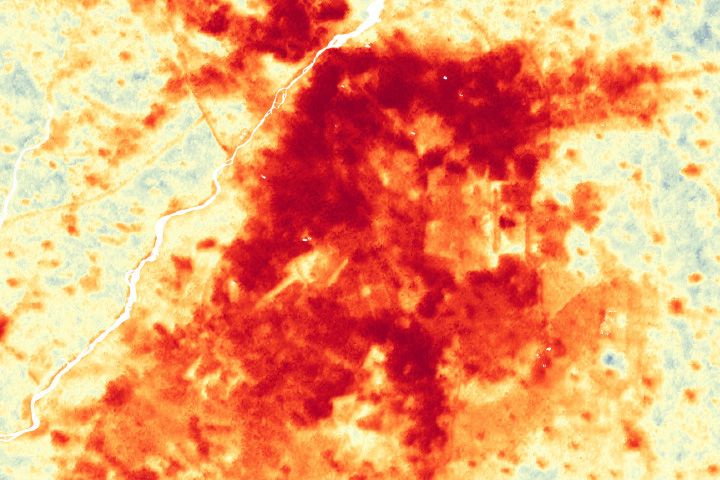
Warmer-than-average temperatures are showing up locally and globally, with consequences for people, landscapes, and ecosystems.
Published Mar 26, 2024
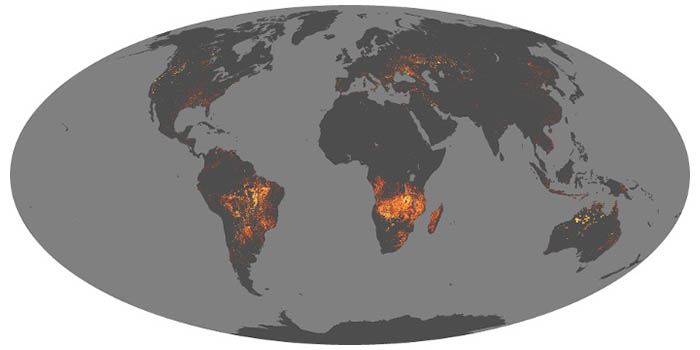
Whether sparked by lightning, intentional land-clearing, or human-caused accidents, wildland fires are burning longer and more often in some areas as the world warms.
Published Feb 27, 2024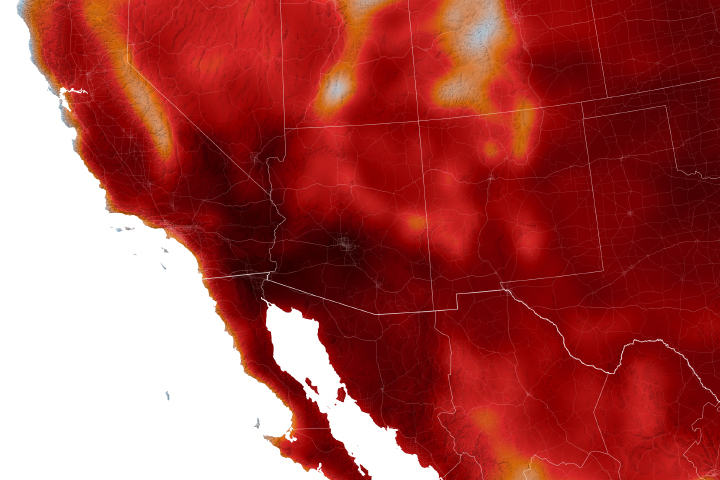
Warmer-than-average temperatures are showing up locally and globally, with consequences for people, landscapes, and ecosystems.
Published Aug 15, 2023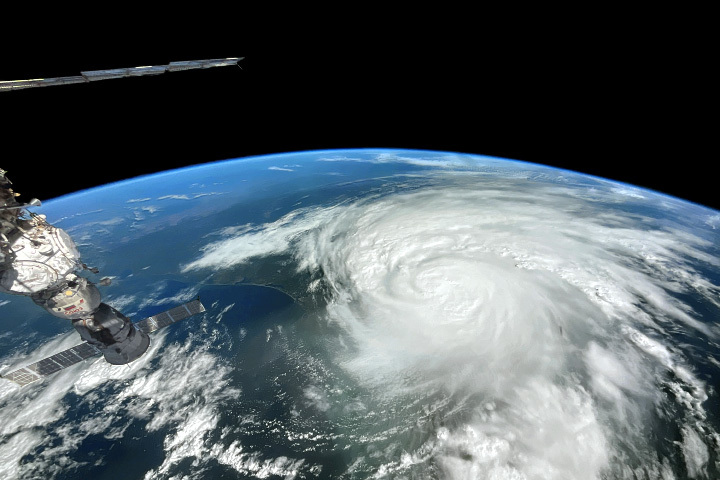
The 2023 season runs from June 1 to November 30, with peak activity generally occurring in September.
Published Jun 1, 2023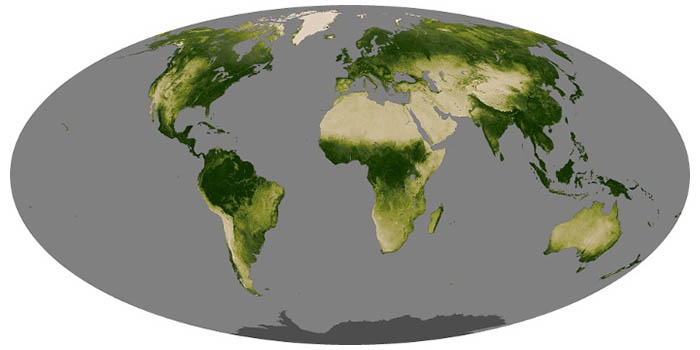
Greenness is an important indicator of health for forests, grasslands, and farms. The greenness of a landscape, or vegetation index, depends on the number and type of plants, how leafy they are, and how healthy they are.