


“As you take this constant drumbeat of new information and research in, remember that this virus is new to science and people have only just started studying it. Doing high-quality, definitive science takes time, sometimes a long time. The appetite for answers is understandably intense, but we also have to try to balance that hunger with patience.”
– Benjamin Zaitchik, a Johns Hopkins University researcher working to understand whether environmental factors are affecting the spread of coronavirus.
Ever since a new and deadly strain of coronavirus (SARS-CoV-2) emerged in China and then spread around the world, the virus has upended life in many countries. Scientists at NASA and other institutions have hustled to track and make sense of our new reality with every tool and technique at their disposal, including satellite data.
As several comprehensive NASA-funded research projects get started, here is a quick roundup of some of the more interesting satellite-related findings about the science of coronavirus and its effects on the environment.
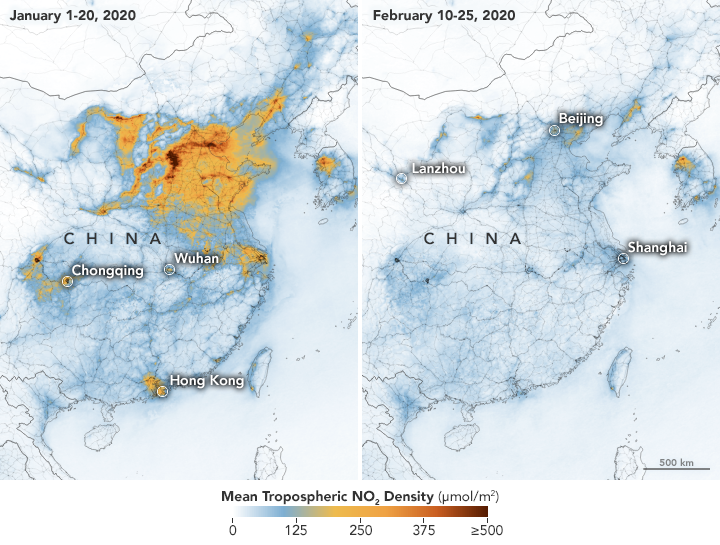
Much of the news about the new coronavirus is grim, but observations of air quality offer a breath of fresh air. Several satellite sensors have detected drops in air pollutants — including nitrogen dioxide, carbon monoxide, and fine particles — following restrictions on travel and economic activity. Teams of scientists have spotted changes in China, Europe, the U.S. Northeast and Southeast, and India.
Look here for some tips on how to find and visualize changes in nitrogen dioxide, one of the gases that most clearly shows the effects of quarantines and economic shutdowns. Also, look here for nitrogen dioxide data for cities all around the world. But beware: As University of Georgia meteorologist Marshall Shepherd has pointed out, clouds and rain can create confusing changes in nitrogen dioxide that have nothing to do coronavirus restrictions.
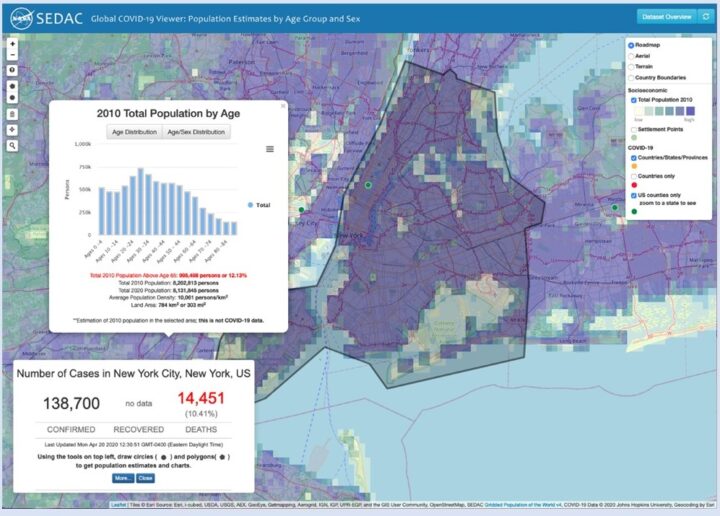
Given how much the virus has changed daily life, many of us find ourselves turning into armchair epidemiologists, trying to make sense of how the virus is spreading and what it means for our local area. If you are interested in taking a close look at new data as it comes in, this simple-to-use mapping tool from NASA’s Socioeconomic Data and Applications Center (SEDAC) might be of interest. It features demographic data, along with regularly updated information on reported global cases of the novel coronavirus (COVID-19). There is a short user guide here.
One of the key unknowns about the new coronavirus is whether environmental conditions — such as temperature, humidity, and exposure to ultraviolet light — have any effect on how the virus spreads or on the severity of the symptoms. NASA-funded researchers are starting to investigate this in several ways, while others are using NASA data in their models and analyses.
Some controlled laboratory research has suggested that exposure to warm air may make it more difficult for the virus to survive and spread. That has led many researchers around the world to start analyzing epidemiological and meteorological data to see if certain environmental factors have a significant impact on the virus in the real world. At this point it is too early to say, declared the National Academy of Sciences in a report on April 7, 2020, but the research continues.
Billions of people are facing something that NASA astronauts have plenty of experience with—living in social isolation for long periods with just a few other people. Here are some tips from astronaut Anne McClain and psychologist Tom Williams.
More than 20 years ago, NASA scientist Ralph Kahn authored a column for the Los Angeles Times anticipating the launch of a new satellite — and ultimately a whole fleet of satellites — that would study Earth.
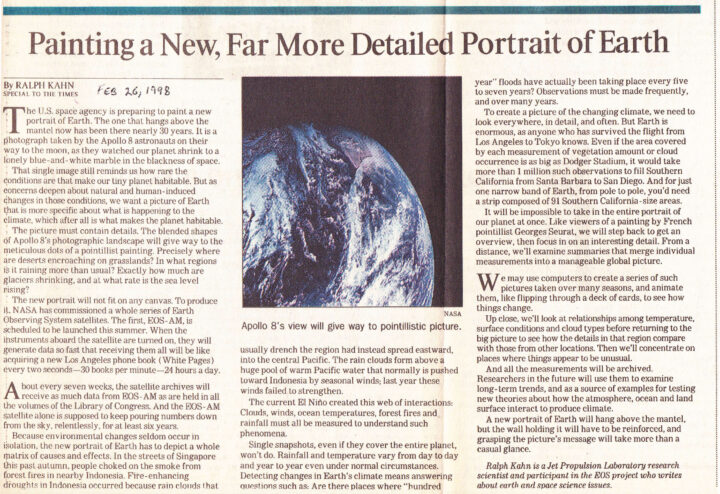
“We want a picture of Earth that is more specific about what is happening to the climate, which after all is what makes the planet habitable,” he wrote. And that picture needed to be rich with detail. “Precisely where are deserts encroaching on grasslands? In what regions is it raining more than usual? Exactly how much are glaciers shrinking, and at what rate is the sea level rising?” he asked.
The first satellite, Terra (originally named EOS-AM), roared into space on December 18, 1999, began collecting data in February and March 2000, and collected its first complete day of MODIS data on April 19, 2000.
“About every seven weeks, the satellite archives will receive as much data from EOS-AM as are held in all the volumes of the Library of Congress. And the EOS-AM satellite alone is supposed to keep pouring numbers down from the sky, relentlessly, for at least six years,” Kahn wrote.
Amazingly, all those numbers from Terra continue to pour down 20 years later. Over time, the flood of data from Terra and several other satellites has turned into scientific discoveries. Bit by bit, the questions Kahn initially posed in his column have been answered.
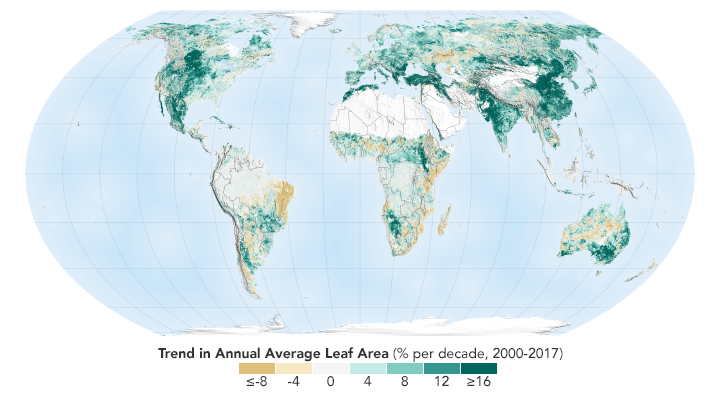
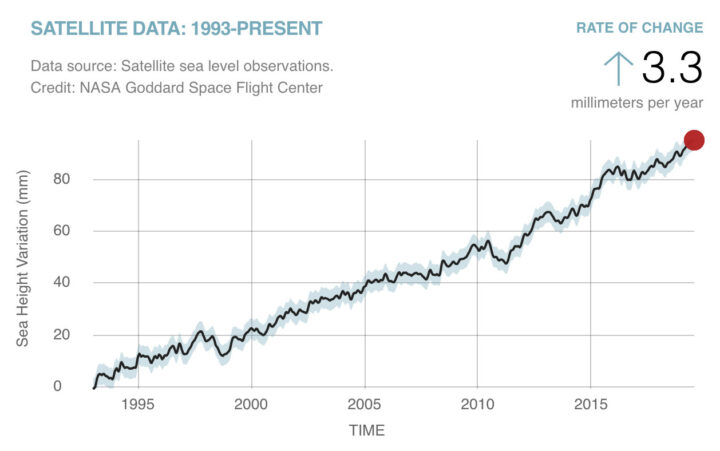
We can say now that sea level is rising at 3.3 millimeters (.13 inches) per year. We can show you a map of where exactly green vegetation has become more common and where it has faded. We can point you to a long-term dataset that will show you precisely where rain has fallen over the past two decades. And we can give you a tour of the world’s glaciers that shows you where they are and many examples of where they are shrinking.
The question to grapple with now: what do we with all this information?
Camp managers and other officials overseeing Rohingya refugee camps in Bangladesh are now incorporating NASA satellite observations into their decision-making. Information like daily rain totals can help inform how to lay out refugee camps and how to store supplies. The goal is to reduce the risk to refugees from landslides and other natural hazards.
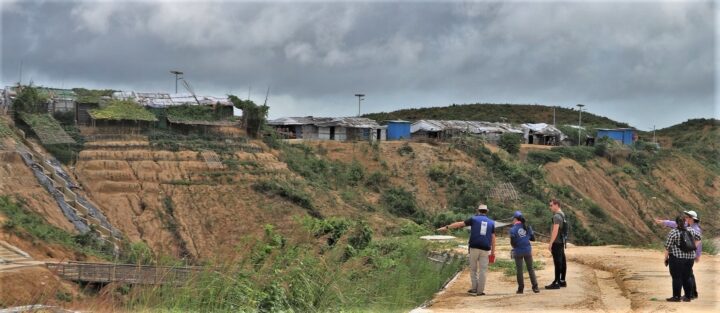
Since August 2017, more than 740,000 Rohingya refugees have fled from Myanmar (Burma) to Bangladesh. Many of them have sought shelter in camps in the hilly countryside, where landslide risks are greatest. When refugee camps were built in the southeastern part of the country, many plants and trees were removed — taking with them the roots that could hold the soil in place and help stabilize the landscape when heavy rains come.
Increasing this danger is Bangladesh’s intense monsoon season. Approximately 80 percent of the country’s yearly rain falls from June to October, bringing with it an increased risk of flash flooding and landslides. For instance, July 2019 storms dropped 14 inches of rain in just 72 hours, causing 26 landslides in Rohingya refugee camps around Cox’s Bazar, Bangladesh. One person was killed and more than 4,500 others were left without shelter.
“We have little information on landslides,” said Hafizol Islam, who is in charge of one of the most densely populated camps at Cox’s Bazar. “It is unpredictable for us and can happen at any time.”
Now Islam and other camp managers have access to maps and a website (updated daily) that provides near real-time NASA data on land use, rainfall, and elevation. Data come from the Global Precipitation Measurement (GPM) mission and the Moderate Resolution Imaging Spectroradiometer (MODIS) instruments on NASA’s Terra and Aqua satellites, among other sources. Taken together, these maps and data provide a clearer picture of when and where landslide hazards are concentrated.
“With landslides, flash floods, and rapid development, the terrain of these camps is constantly changing,” said Robert Emberson, a postdoctoral fellow at NASA’s Goddard Space Flight Center.
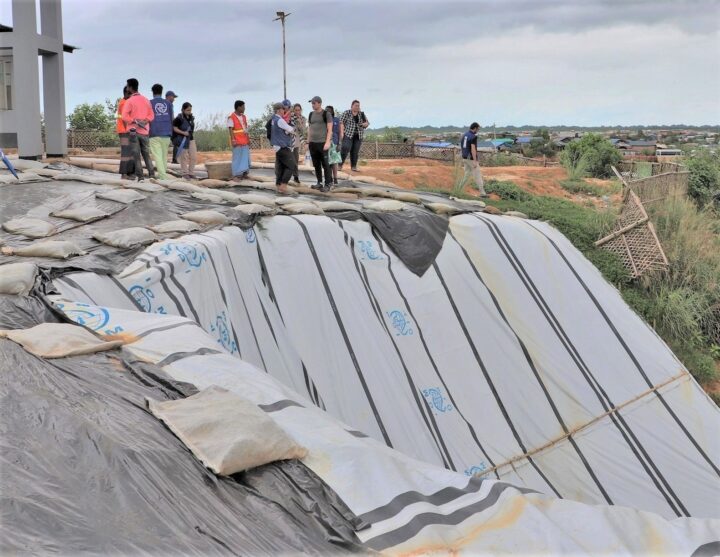
Emberson and other researchers from NASA’s Earth Applied Sciences Disasters Program and Columbia University’s International Research Institute for Climate and Society (IRI) are using new approaches to work alongside humanitarian end-users and develop products to address pressing needs in vulnerable settings. The partnership seeks the feedback of the local people affected and develops maps based on their input.
“We need to understand if, why, and when existing risk information is being used,” said Andrew Kruczkiewicz of IRI, one of the principal investigators of the project. “This strengthens the development of data services for humanitarian emergencies, where decisions and priorities change rapidly. Working in teams that bridge traditional professional and disciplinary boundaries gives data and climate scientists the opportunity to learn more about decision-making in specialized contexts.”
The need for coordination is pressing. Bangladesh has seen steadily increasing rainfall totals over the past 50 years. Climate change is making monsoons in Asia more extreme, and it may be doubling the likelihood of extreme rainfall events even before monsoon season begins.
“The partnership with NASA and IRI helps the UN agencies to assess risks like landslides or flash flooding and supports the disaster management in a scientific way to save lives and reduce damages in the refugee camps,” said Cathrine Haarsaker, a project manager for UNDP Disaster Risk Management.
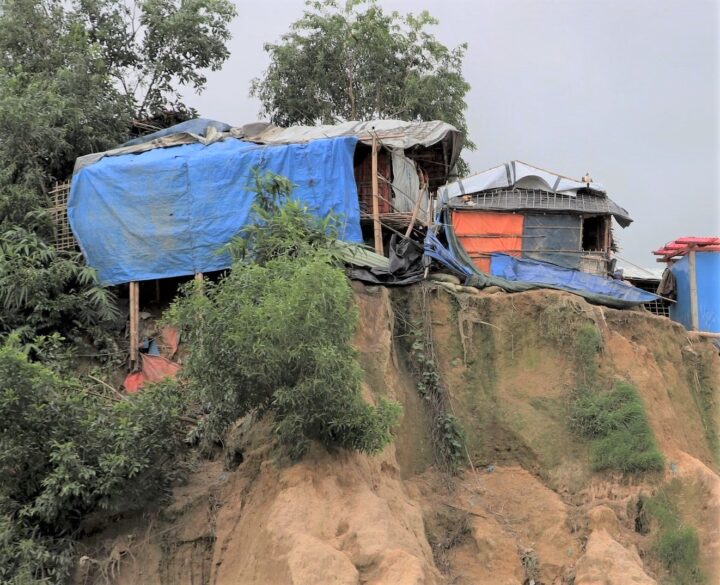
Emberson said seeing the camps in person brought home the importance of connecting with the people on the ground. “Working with satellite data can sometimes feel quite abstract and separate from the people within the images,” he said. “Visiting the camps not only helped us understand more about the specific problems associated with landsliding to help improve our models in the future, but also drove home the human side to this disaster, emphasizing the urgency of our work.”
Who knew that being a scientist could be as easy as pointing your phone at the sky? This month, NASA and the GLOBE Program are asking citizen scientists to take out their phones and report what kinds of clouds they see above them.
From October 15 to November 15 citizen scientists young, old, and in-between can submit up to ten cloud observations per day using the GLOBE Observer app or one of GLOBE’s other data entry options (for trained members). Participants with the most observations will receive a personalized thank you from a NASA scientist.
“What excites researchers about GLOBE observations is the ability to see what’s up in the sky from volunteers’ perspectives all over the world,” said Marilé Colón Robles, lead for the GLOBE Clouds Team at NASA’s Langley Research Center. “What our eyes can see is difficult to fully duplicate with instruments. Merging these views is what makes a complete and impactful story.”
“We want to do a data challenge in the fall and see if there are any differences from what was observed during the spring data challenge of 2018,” said Colón Robles. “From thin, high clouds that are hard for satellites to detect to dust storms that impact our daily lives, these observations play an important role in better understanding our atmosphere.”
At NASA, scientists work with a suite of satellite instruments known as the Clouds and the Earth’s Radiant Energy System (CERES). Though they have these highly sensitive instruments, it can sometimes be difficult for scientists to distinguish features such as cirrus clouds from snow cover in their imagery because both are cold and bright from a satellite perspective. By comparing satellite images from a particular area with data submitted by citizen scientists, researchers can differentiate between the two.
Lucky GLOBE observers might make an observation while the Cloud-Aerosol Lidar and Infrared Pathfinder Satellite Observation (CALIPSO) is overhead. CALIPSO is a joint mission between NASA and the French space agency (CNES) that uses laser pulses to measure clouds and atmospheric aerosols. Citizen scientists who make observations at the same time and place as CALIPSO will receive an emailed satellite comparison of CALIPSO’s measurements showing features such as high clouds, dust, and smoke. Scientists are especially interested in these observations in order to improve their understanding of dust storms. During the challenge, make sure you turn on daily satellite notifications in the app or use this satellite overpass website to see the schedule for your location.
“Last year’s challenge gave researchers special glimpses into cloud types around the world,” said Colón Robles. “Photographs provided by observers gave insight into events such as dust storms and wildfires. Our hope is to once again learn from the community and together study our atmosphere.”
The 2018 data challenge, which took place in the spring, received more than 56,000 cloud observations from more than 15,000 locations in 99 countries and Antarctica.
NASA is a sponsor of GLOBE, an international science and education program that provides students and the public with the opportunity to participate in data collection and the scientific process. NASA GLOBE Observer is a free smartphone app that lets anyone make citizen science observations from the palm of their hand.
Cloud Identification Resources and Tips
Data collection and data entry help
The UK’s Antarctic Place-names Committee has agreed that seven ice features in western Antarctica should be named for Earth-observation satellites. One of them is Landsat Ice Steam.
The new designations were announced on June 7, 2019. The ice features are all located in Western Palmer Land on the southern Antarctic Peninsula.
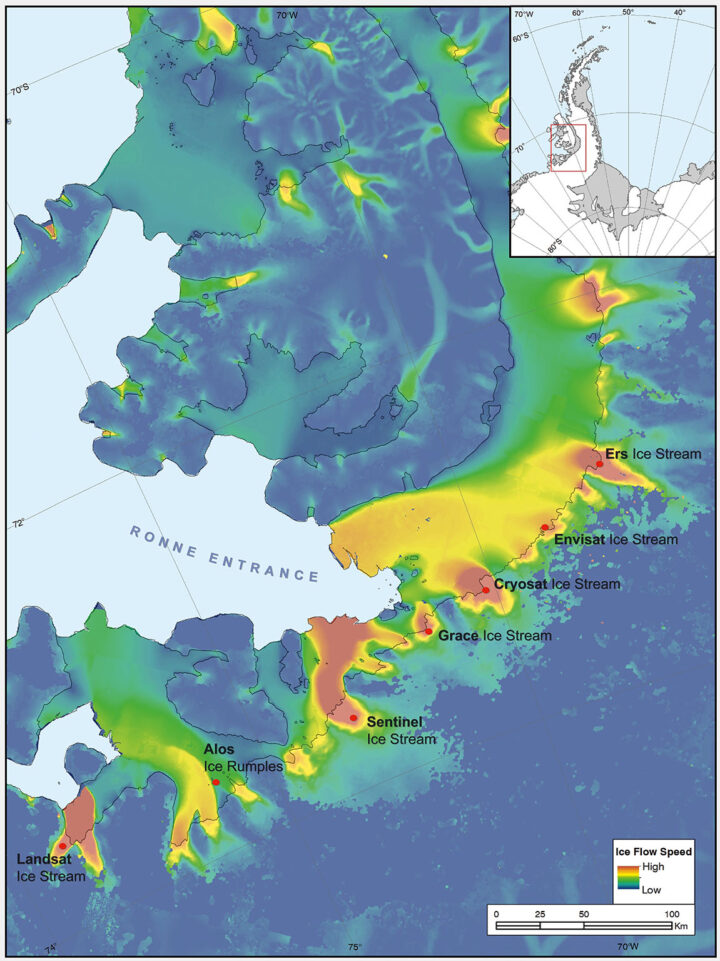
The seven features ring George VI Sound like pearls on a necklace. The new names, as officially entered into the British Antarctic Territory Gazetteer, are (from west to east): Landsat Ice Steam, ALOS Ice Rumples, Sentinel Ice Stream, GRACE Ice Stream, Envisat Ice Stream, Cryosat Ice Stream, and ERS Ice Stream.
The UK has submitted the new names for the fast-moving ice features to Scientific Committee on Antarctic Research (SCAR), which maintains a gazetteer or registry, of names officially adopted by individual nations. Under the Antarctic Treaty, signatory nations confer on geographic feature names, but each nation’s naming authority formally adopts new names. The U.S. Board on Geographic Names will meet in July and may discuss at that meeting whether the names adopted by the UK also will be adopted by the US. The question of using the term “glacier” for the ice features instead of “ice stream” is also part of each nation’s naming decision.
The new names were proposed by Anna Hogg, a glaciologist with the Center for Polar Observation and Modelling at the University of Leeds. In research published in 2017, Hogg found that glaciers draining from the Antarctic Peninsula were accelerating, thinning, and retreating, with implications for global sea level rise. The fast-moving glaciers that Hogg and colleagues tracked with radar and optical satellite imagery were unnamed. In her paper, the glaciers had to be designated by latitude and longitude.
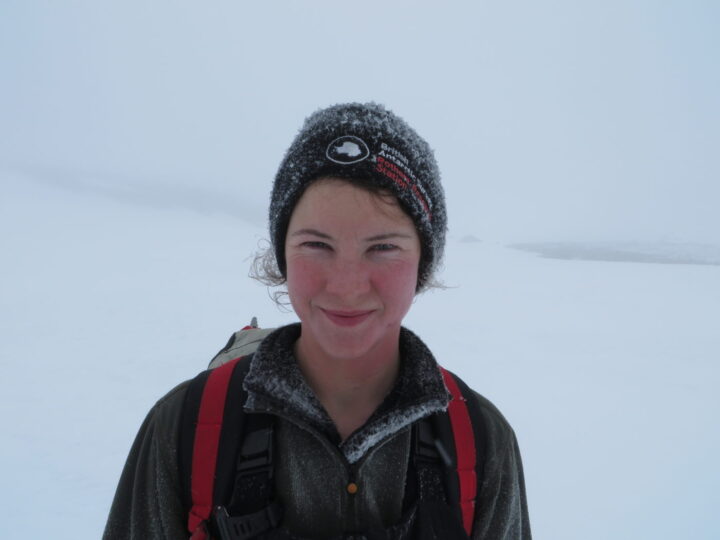
Satellites had enabled Hogg and her team to clock the speed of these nameless ice features—some with rates faster than 1.5 meters/day. In tribute to the spaceborne instruments, Hogg came up with a way to describe the fast-moving ice features more succinctly—name them after the satellites that had helped her understand their behavior.
Hogg proposed to the U.K.’s Antarctic Place-names Committee that the features should be named for Landsat, Sentinel, ALOS PALSAR, ERS, GRACE, CryoSat, and Envisat. She was notified in early June that the committee had agreed to adopt the names, which provide a way to recognize international collaboration, as fifteen space agencies currently collaborate on Antarctic data collection.
“Satellites are the heroes in my science of glaciology,” Hogg told the BBC. “They’ve totally revolutionized our understanding, and I thought it would be brilliant to commemorate them in this way.”
Naming the glaciers after satellites is also a celebration of data fusion. “Our understanding of ice velocities and ice sheet mass balance has come from putting many different remote sensing data sets together—optical, radar, gravity, and laser altimetry,” said Jeff Masek, the NASA Landsat 9 Project Scientist. “Landsat has been a key piece in assembling that larger puzzle. Naming an ice stream after Landsat is a fitting way to recognize the value of long-term Earth Observation data for measuring changes in Earth’ polar regions.”
Read more from NASA’s Landsat science and outreach team, including the history of Antarctic observation with Landsat. Read more about all of the glaciers and their namesake satellites, as told by the European Space Agency. And read about the island discovered by and named for Landsat, and the woman who discovered it.
Correction, June 27, 2019: SCAR’s role in the Antarctic naming process was incorrectly described in the earlier version of this article. Updates were provided by Dr. Scott Borg, Deputy Assistant Director of the National Science Foundation’s Directorate for Geosciences, and Peter West, the Outreach Program managers for NSF’s Office of Polar Programs, to correctly describe the naming process.
In the early 19th century, Meriwether Lewis and William Clark led an ambitious expedition across the western United States. They greatly expanded our knowledge of the country’s geography and biological diversity through their specimen collection, mapping of the landscape, and detailed journal entries.
This year NASA and the National Park Service are encouraging the public to follow in the footsteps of Lewis and Clark through a new citizen science challenge. From June 1 to September 2, citizens are invited to use their smart phones and the NASA GLOBE Observer app to map land cover along the Lewis and Clark National Historic Trail to assist scientists studying environmental changes.
Land cover–such as grass, pavement, or trees–influences the water and energy cycles and influences a community’s vulnerability to natural disasters. NASA studies land cover changes from space as part of its mission to better understand our planet and improve lives.
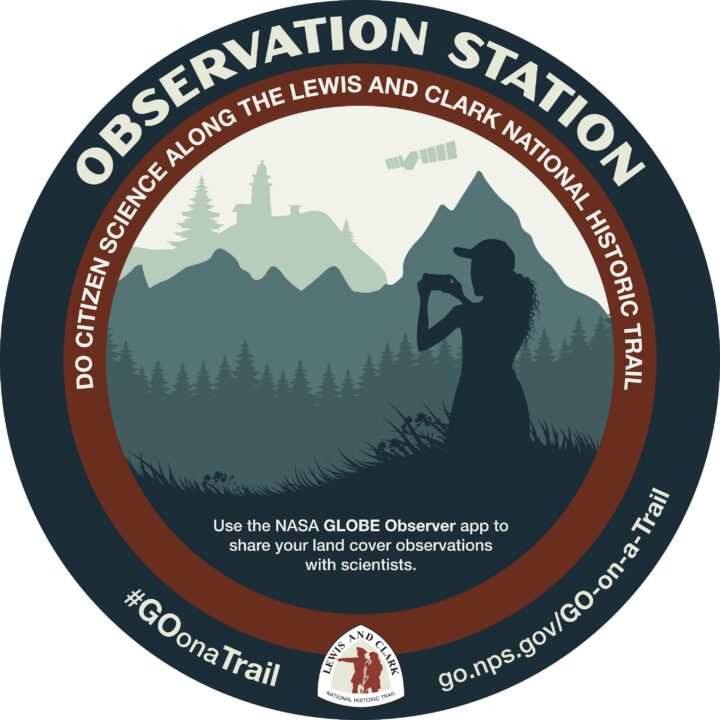
To participate in the “GO on a Trail” challenge, download the free GLOBE Observer app from the Apple App Store or Google Play. Use the Land Cover tool to make observations of the landscape. Any observation made along the 5,000-mile-long Lewis & Clark trail from Pittsburgh to the mouth of the Columbia River earns points. The top participants will receive recognition and GO on a Trail commemorative material.
A good place to get started is at an observation station marked with a large sticker (image above) at Lewis and Clark visitor centers and museums. To navigate to sites of interest along the trail, the Lewis and Clark National Historic Trail and GLOBE Observer teams have provided an online map.
“We hope that by becoming involved with this project, people will care about the trail and become its stewards,” said Dan Wiley, chief of integrated resource stewardship for the Lewis and Clark National Historic Trail. Wiley notes that the challenge will both spark a general interest in science and show the public how it can be involved in collecting vital information for decision makers.
GLOBE Observer is an app-based citizen science program active in more than 120 countries. The program invites citizens to contribute land cover, cloud, mosquito, and tree height observations to NASA and the science community. NASA-funded scientists are eager to see citizen science observations of land cover along this trail because of its wide range of ecological regions. Data collected during the challenge could help improve satellite-based mapping of land cover across the continent.
“We are observing and monitoring our changing home planet from space to better understand how it is changing and what are the main drivers of change,” said Eric Brown de Colstoun, a scientist at NASA Goddard Space Flight Center. “The view from the ground provided by the challenge participants is one component that helps us verify the space-based data.”
Even if you are not able to visit the Lewis and Clark Trail this summer, you can still join the GO on a Trail challenge from any of the more than 120 countries where GLOBE Observer is active. Just get outdoors and map the land cover around you. The top participants from beyond the trail will also receive recognition and commemorative material.
“Lewis and Clark and their team were exploring a totally new environment to them,” said Brown de Colstoun. “We invite you to get out and explore, and document the places you know and care about. Go on a trail and do science along with us.”
NASA GLOBE Observer and Lewis and Clark National Historic Trail will provide regular updates about the GO on a Trail challenge via social media throughout the summer with the hashtag #GOonaTrail. Follow GLOBE Observer on Facebook @nasa.globeobserver or Twitter @NASAGO. Follow the Lewis and Clark National Historic Trail on Facebook @lewisandclarknht, Twitter @lewisclarktrail, and Instagram @lewisandclarknht or visit the website at: https://www.nps.gov/lecl/index.htm.
On April 29, 1999, NASA Earth Observatory (EO) started delivering science stories and imagery to the public through the Internet. So much has changed in those 20 years…
+ In 1999, about 3 to 5 percent of the world had Internet access. About 41 percent of American adults used the World Wide Web, most often to look at the weather. Today an estimated 56 percent of the world’s population (4.3 billion people) are active on the Internet.
+ At the end of the 20th century, all EO readers came to us through a computer, mostly desktops. One third of them were connecting via dial-up modem. Today, about 40 percent of our audience arrives to the web site via mobile phones and tablets on public wifi and cellular networks. Yet even now, 65,000 of our most loyal followers subscribe to our newsletters. Many others subscribe to our RSS feeds.
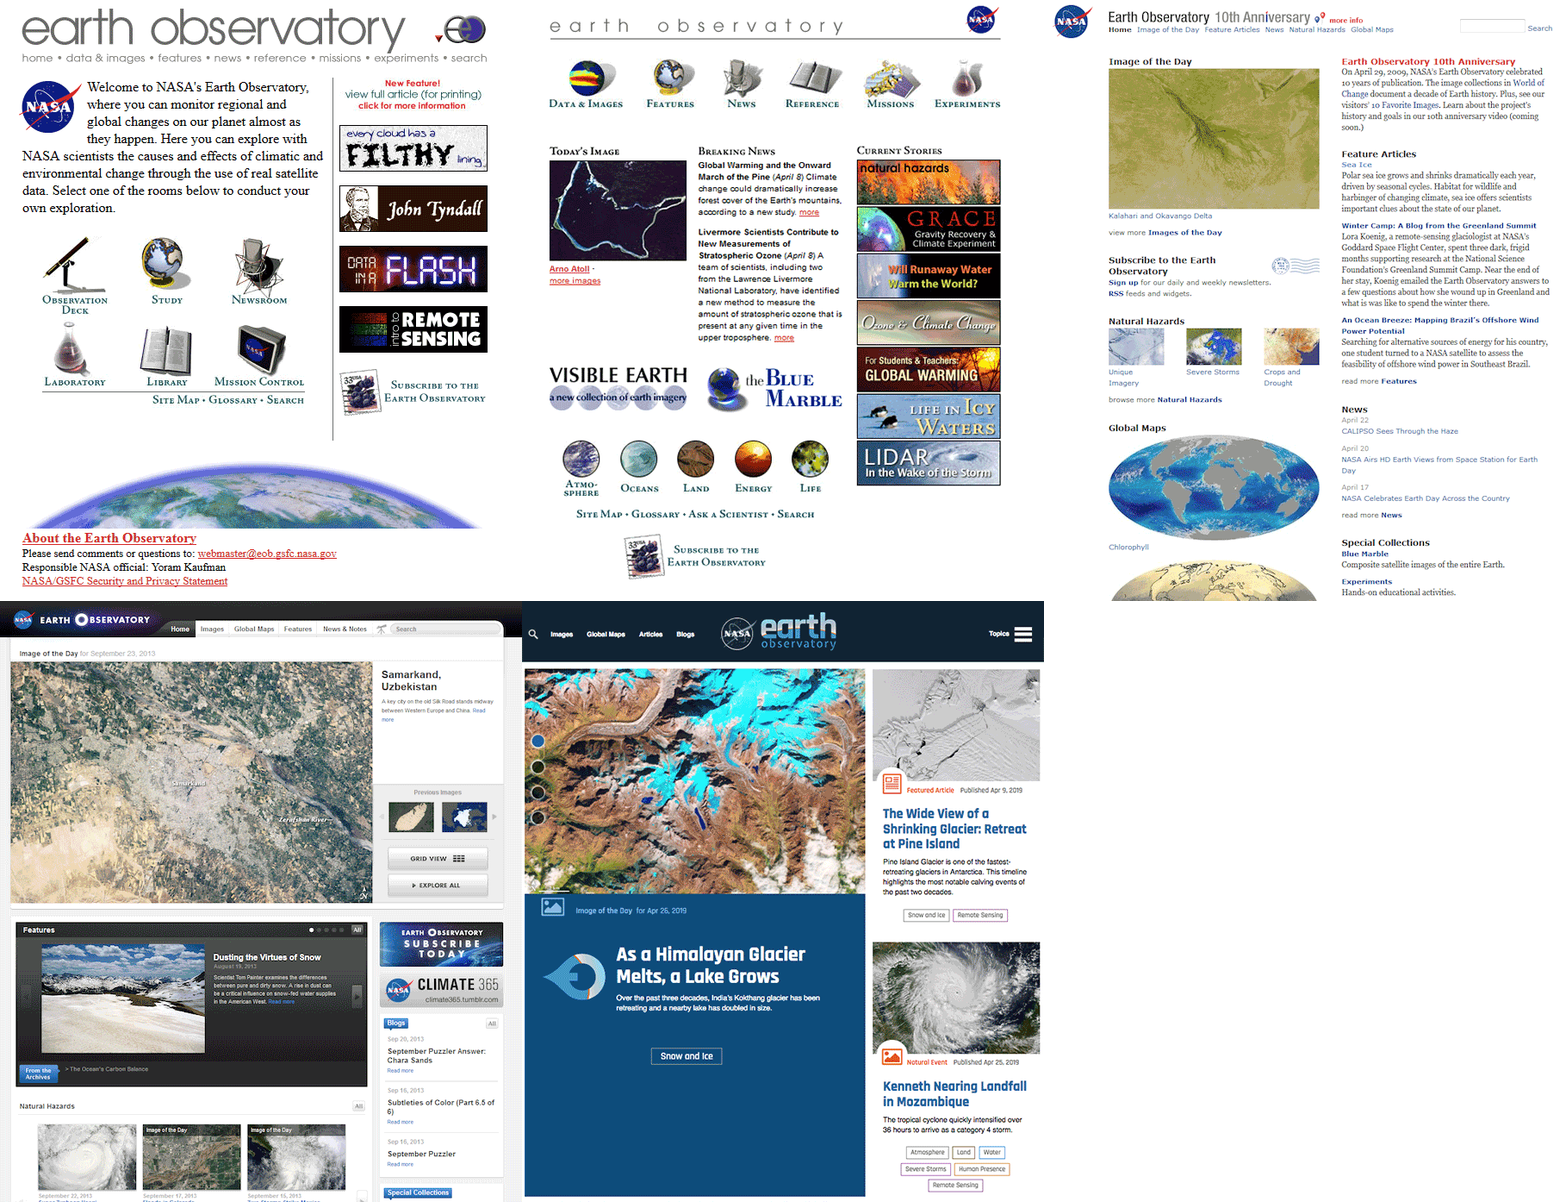
+ In 1999, “social” media mostly consisted of chatrooms and newsgroups. Even by 2005, only 5 percent of Americans were using social media. Today about 69 percent of adults use social media, and people are just as likely to see Earth Observatory content on social platforms as on our web site. Ten million people follow EO and NASA Earth science on Facebook, with 1.3 million more on Twitter, and 500,000 on Instagram.
+ When EO launched, images from Earth science satellites were generally available about a month after acquisition. Public access to science data and imagery was extremely limited, highly filtered, and sometimes required a fee. Two decades later, many NASA Earth science observations are available freely on the web within hours of acquisition.
+ On our first day online, the site got 400 pageviews–most of them were likely colleagues and relatives. Today we get about 50,000 views per day.
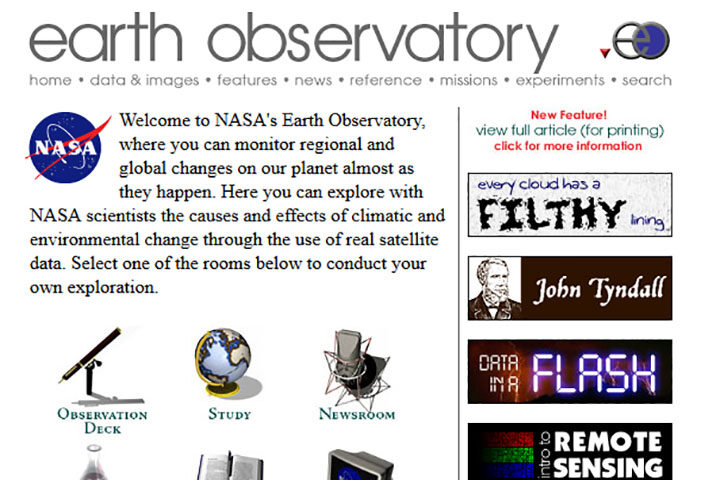
+ In our first year, we published 35 “Images of the Week” and 9 feature stories. By 2001, we started delivering an Image of the Day. Since launch, we have published more than 6,900 Images of the Day, 8,300 natural hazards images, and 450 features and videos. Yes, more than 15,000 image-driven stories, and all of them are still available in our archive.
+ In 1999, two members of our staff were in elementary school and three were in high school. The readers of EO Kids were not born yet.
The technology of science and the Internet has changed in a generation, and our site has evolved and grown with the changes. But our core values have not changed. You find us on more platforms and with some new approaches, but you can still count on us to deliver beautiful, newsworthy, interesting, and scientifically important images and stories. Our editorial team has more than 110 years of experience in science communication and data visualization, and we bring that depth of knowledge to every story, 365 days a year.
None of this would be possible without the many scientists, engineers, communicators, data hounds, patrons, and friends inside and outside of NASA who review our work, tip us off to stories and images, share their scientific insights, and inspire and challenge us. Thank you.
As we celebrate our 20th year, we are going to share some looks back and some looks ahead. In the next twelve months, look for…
If you have been with us for many (or all) of our 20 years, thank you. We have some of the most engaged, challenging, and thoughtful readers on the planet, and we work hard to live up to your trust and interest. If you are new to the site, bring a friend. We have 15,000 stories about Earth to share, with more being added every day.
Related Links and References
Earth Observatory 10th Anniversary
Pew Research Center (2018) World Wide Web Timeline
Internet World Stats (2019) Internet Growth Statistics
Wikipedia (2019) Global Internet Usage
Join a mosquito mapping blitz for Citizen Science Day through GLOBE Observer.
Earth observations take place on many spatial scales. Some observations originate from sensors in space; others can happen with a mobile phone in the palm of your hand. GLOBE Observer is a free mobile app that connects an international network of citizen scientists with the broader scientific community in an effort to document and analyze changes taking place in Earth’s air, land, water, and life. The app is the centerpiece of a citizen science blitz now underway.
Both globalization and a changing climate have caused countless living creatures to adjust their range and distribution. For human health, one of the most concerning impacts of a changing climate is the range expansion of mosquitoes. These flying vectors of disease are responsible for illness in millions of people; they also cause more than 700,000 deaths each year.
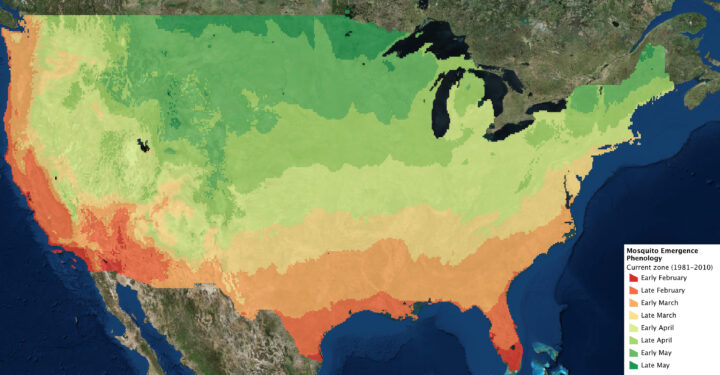
The northern hemisphere is now greening up in response to changes in sunlight and temperatures, and mosquito season is either just beginning or underway in much of the contiguous United States. The map above indicates when the first appearance of mosquitoes can be expected based on past weather data. The actual time of first appearance in a region can vary by several weeks, depending on the weather and other variables.
The GLOBE Observer app has a new tool known as the Mosquito Habitat Mapper, which makes it possible for citizen scientists to observe, record, and share data about mosquito breeding sites using a mobile phone. The data are important to scientists trying to predict disease outbreaks and epidemics. Observations provided by citizen scientists, combined with satellite observations and models, can make it possible to track the range and spread of invasive mosquitoes.
With the Mosquito Habitat Mapper, citizen scientists can report active and potential breeding sites in their communities. And using a built-in taxonomic key, GLOBE Observers can help determine whether the mosquito larvae have the potential to transmit disease pathogens to humans.
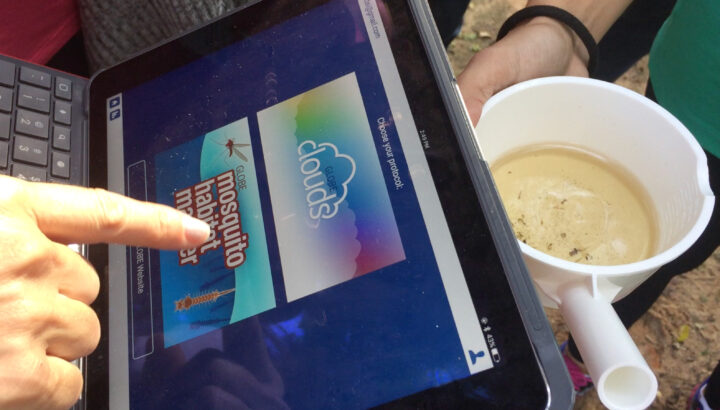
GLOBE Observers also can have an immediate impact on health in their community. In the last step of Mosquito Habitat Mapper, users report whether they were able to remove a breeding site. This can be accomplished in most cases by simply tipping and tossing standing water that is found in containers, or by covering stored water with a net or a lid. For larger water bodies such as ponds, irrigation ditches, or swamps, the reports about breeding sites can be used by mosquito surveillance agencies.
In this way, GLOBE Observers are not only engaged scientifically, they can become agents of change in their community. The World Health Organization (WHO) identifies source reduction–the elimination of mosquito breeding sites–as the most effective way to protect human populations and reduce the threat of mosquito vector-borne disease.
The GLOBE Observer Mosquito Blitz kicked off on April 7, 2019, and ends on Citizen Science Day (April 13). Join in this effort by downloading the app. Follow GLOBE Observer on social media during Mosquito Blitz week on Facebook or Twitter. Check out the Mosquito Blitz website and GLOBE Mission Mosquito for more mosquito resources.
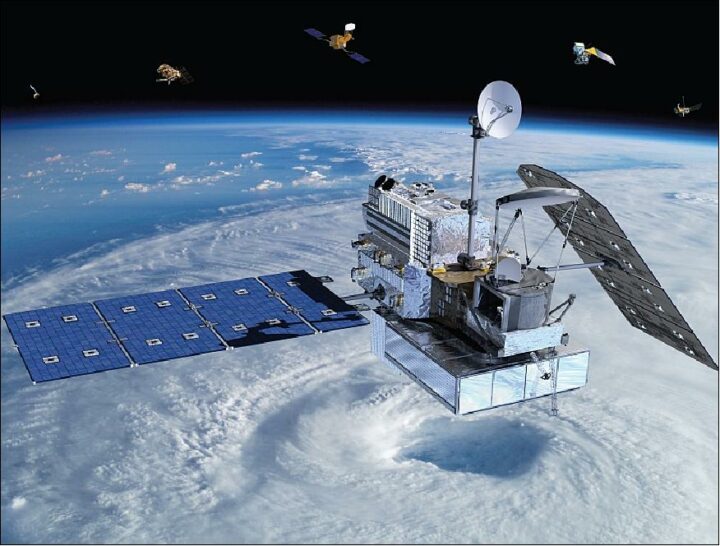
On February 27, 2014, a Japanese rocket launched NASA’s latest satellite to advance how scientists study raindrops from space. The satellite, the Global Precipitation Measurement (GPM) Core Observatory, paints a picture of global precipitation every 30 minutes, with help from its other international satellite partners. It has provided innumerable insights into Earth’s precipitation patterns, severe storms, and into the rain and snow particles within clouds. It has also helped farmers trying to increase crop yields, and aided researchers predicting the spread of fires.
In honor of GPM’s fifth anniversary, we’re highlighting some of our favorite and most unique Earth Observatory stories, as made possible by measurements taken by GPM.
The Second Wettest October in Texas Ever
In Fall 2018, storm after storm rolled through and dumped record rainfall in parts of Texas. When Hurricane Willa hit Texas around October 24, the ground was already soaked. One particularly potent cold front in mid-October dropped more than a foot of rain in areas. By the end of the month, October 2018 was the second wettest month in Texas on record.
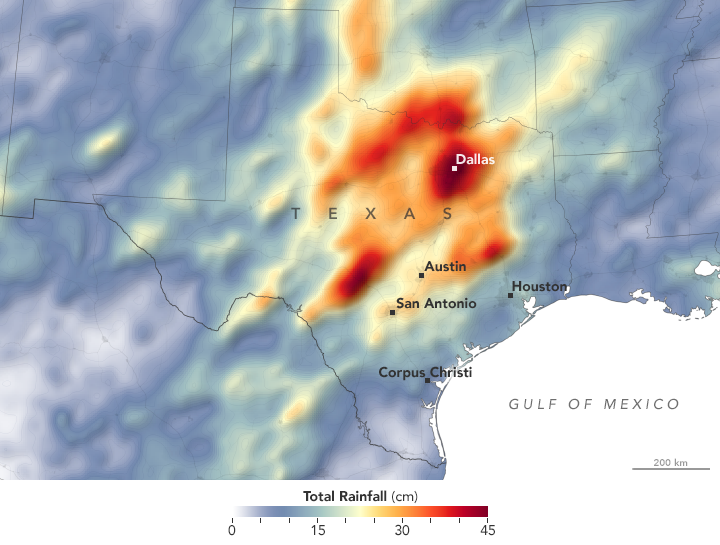
GPM measured the total amount of rainfall over the region from October 1 to October 31, 2018. The brightest areas reflect the highest rainfall amounts, with many places receiving 25 to 45 centimeters (10 to 17 inches) or more during this period. The satellite imagery can also be seen from natural-color satellite imagery.
Observing Rivers in the Air
With the GPM mission’s global vantage point, we can more clearly see how weather systems form and connect with one another. In this visualization from October 11-22, 2017, note the long, narrow bands of moisture in the air, known as “atmospheric rivers.” These streams are fairly common in the Pacific Northwest and frequently bring much of the region’s heavy rains and snow in the fall and winter. But this atmospheric river was unusual for its length—extending roughly 8,000 kilometers (5,000 miles) from Japan to Washington. That’s about two to three times the typical length of an atmospheric river.

Since atmospheric rivers often bring strong winds, they can force moisture up and over mountain ranges and drop a lot of precipitation in the process. In this case, more than four inches of rain fell on the western slopes of the Olympic Mountains and the Cascade Range, while areas to the east of the mountains (in the rain shadow) generally saw less than one inch.
Increasing Crop Yield for Farmers in Pakistan
Knowing how much precipitation is falling or has fallen is useful for people around the world. Farmers, in particular, are interested in knowing precipitation amounts so they can prevent overwatering or underwatering their crops.
The Sustainability, Satellites, Water, and Environment (SASWE) research group at the University of Washington has been working with the Pakistan Council of Research in Water Resources (PCRWR) to bring this kind of valuable information directly to the cell phones of farmers. A survey by the PCRWR found that farmers who used the text message alerts reported a 40 percent savings in water. Anecdotally, many farmers say their income has doubled because they got more crops by applying the correct amount of water.
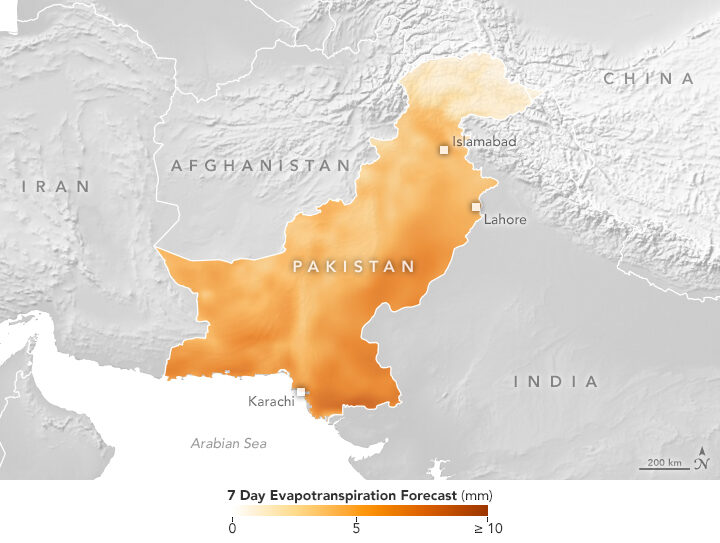
The map above shows the forecast for evapotranspiration for October 16-22, 2018. Evapotranspiration is an indication of the amount of water vapor being removed by sunlight and wind from the soil and from plant leaves. It is calculated from data on temperature, humidity, wind speed, and solar radiation, as well as a global numerical weather model that assimilates NASA satellite data. The team also looks at maps of precipitation, temperature and wind speed to help determine crop conditions. Precipitation data comes from GPM that is combined with ground-based measurements from the Pakistan Meteorological Department.
Forecasting Fire
Precipitation can drastically affect the spread of a fire. For instance, if a region has not received normal precipitation for weeks or months, the vegetation might be drier and more prone to catching fire.
NASA researchers recently created a model that analyzes various weather factors that lead to the formation and spread of fires. The Global Fire Weather Database (GFWED) accounts for local winds, temperatures, and humidity, while also being the first fire prediction model to include satellite–based precipitation measurements.
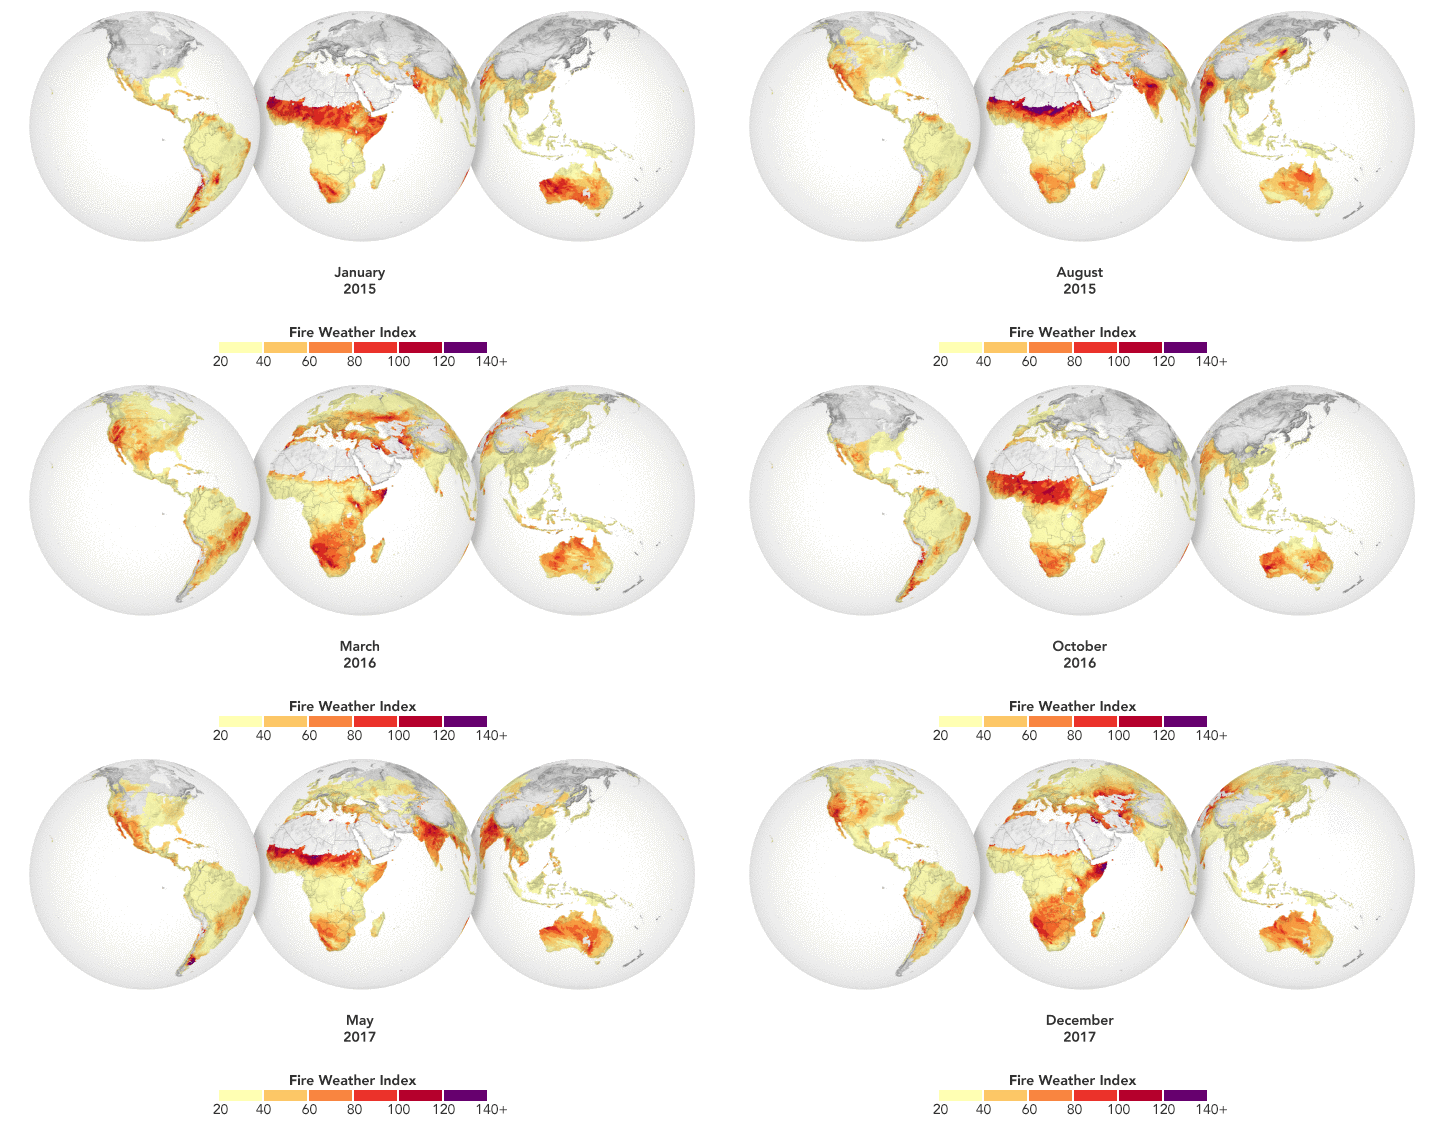
The animation above shows GFWED’s calculated fire danger around the world from 2015 to 2017. The model compiles and analyzes various data sets and produces a rating that indicates how likely and intense fire might become in a particular area. It is the same type of rating that many firefighting agencies use in their day–to–day operations. Historical data are available to understand the weather conditions under which fires have occurred in the past, and near–real–time data are available to gauge current fire danger.
Automatically Detecting Landslides
In this mountainous country of Nepal, 60 to 80 percent of the annual precipitation falls during the monsoon (roughly June to August). That’s also when roughly 90 percent of Nepal’s landslide fatalities occur. NASA researchers have designed an automated system to identify potential landslides that might otherwise go undetected and unreported. This information could significantly improve landslide inventories, leading to better risk management.
The computer program works by scanning satellite imagery for signs that a landslide may have occurred recently, looking at topographical features such as hill slopes.
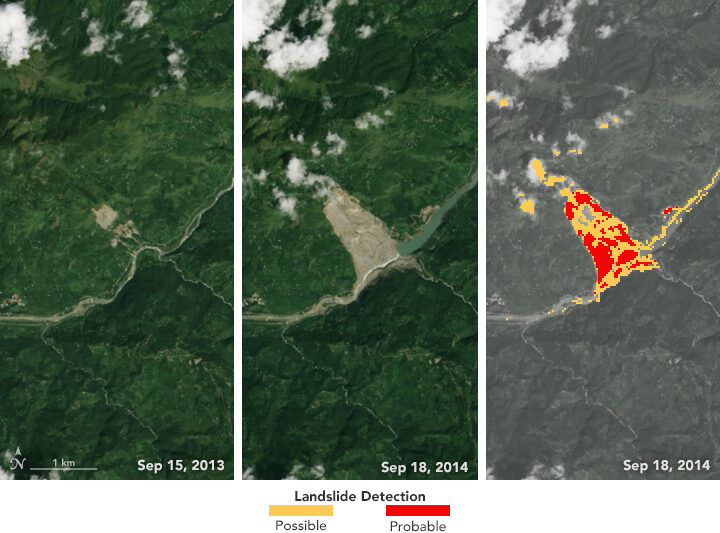
The left and middle images above were acquired by the Landsat 8 satellite on September 15, 2013, and September 18, 2014—before and after the Jure landslide in Nepal on August 2, 2014. The image on the right shows that 2014 Landsat image processed with computer program. The red areas show most of the traits of a landslide, while yellow areas exhibit a few of the proxy traits.
The program also uses data from GPM to help pin when each landslide occurred. The GPM core satellite measures rain and snow several times daily, allowing researchers to create maps of rain accumulation over 24-, 48-, and 72-hour periods for given areas of interest—a product they call Detecting Real-time Increased Precipitation, or DRIP. When a certain amount of rain has fallen in a region, an email can be sent to emergency responders and other interested parties.
The GPM Core Observatory is a joint satellite project by NASA and the Japan Aerospace Exploration Agency. The satellite is part of the larger GPM mission, which consists of about a dozen international satellite partners to provide global observations of rain and snow.
To learn more about GPM’s accomplishments over the past five years, visit: https://pmm.nasa.gov/resources/featured-articles-archive
To learn more about the GPM mission, visit: https://www.nasa.gov/mission_pages/GPM/main/index.html
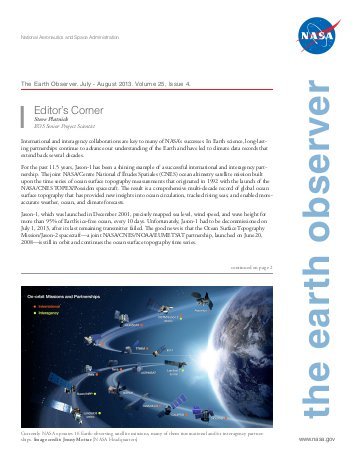 A new edition of The Earth Observer, a bi-monthly publication that covers the nuts-and-bolts of NASA’s Earth Observing System, is out. Here are a few excerpts, along with some musical headlines that may get you humming as you read. You can download the full issue here. Back issues here.
ICE ICE BABY
The Advanced Topographic Laser Altimeter System (ATLAS), the lone instrument on ICESat-2, successfully fired its laser on September 30 after the mission operations team completed testing of the spacecraft and opened the door protecting the optics. The primary science mission for ICESat-2 is to gather enough observations to estimate the annual height change of the Greenland and Antarctic ice sheets to within four millimeters. Hundreds of billions of tons of land ice melt into the ocean annually, raising sea levels worldwide. In recent years, meltwater from Greenland and Antarctica alone has raised global sea level by more than a millimeter a year, and the rate is increasing.
THIS LANDSAT IS YOUR LANDSAT
In January 2008, the U.S. Geological Survey and NASA decided to open the full Landsat image archive for public access on a non discriminatory, no-cost basis. This change in Landsat’s data policy ushered in a new era of Landsat data uses and applications while also revolutionizing the way Landsat has been woven into scientific discovery, economic prosperity, and public policy for management of land and water resources across a range of scales.
DEVELOPING SATELLITE SKILLS FOR 525,600 MINUTES (TIMES TWENTY)
From 1998 to the current 2018 fall term, the NASA DEVELOP National Program has engaged 4,671 participants who have conducted 931 projects. The program bridges the gap between science and society by demonstrating how NASA Earth Science data can be applied to environmental decision making. These projects have demonstrated the applications of NASA Earth observations to a wide variety of sectors, addressing topics such as drought monitoring, vector-borne disease risk, water-quality assessments, pre- and post-wildfire mapping, agriculture monitoring, and critical habitat identification.
I CAN SEE CLEARLY NOW
The first Earth Science Decadal Survey identified CLARREO as a Tier-1 (i.e., highest) priority mission for development. The CLARREO Pre-Formulation Mission, referred to herein as the “Full” CLARREO mission, was recommended to better understand climate change. The foundation of CLARREO is the ability to produce highly accurate climate records to test climate projections in order to improve models and enable sound policy decisions.