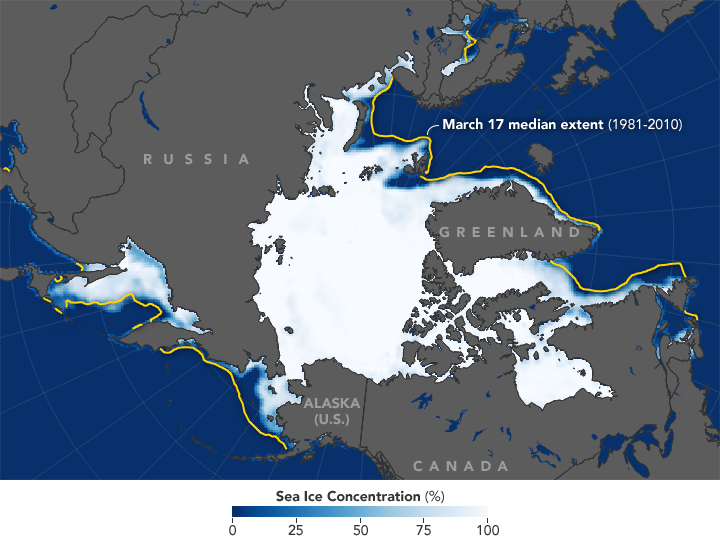


In late March 2018, scientists from the National Snow and Ice Data Center (NSIDC) and NASA reported that Arctic sea ice had reached its annual maximum extent. Once again, the ice cover was well below average. The four smallest maxima in the satellite record have all occurred in the past four years, continuing a decades-long trend of shrinking ice in the Arctic Ocean and surrounding waterways.
The annual maximum and minimum ice extents for the Arctic region have become steadily smaller over the past 40 years, and the percentage of thick, multi-year ice has been shrinking considerably. This thinning and retreating ice has opened the Arctic Ocean to new opportunities, but also serious environmental concerns. Shipping traffic fits into both categories.
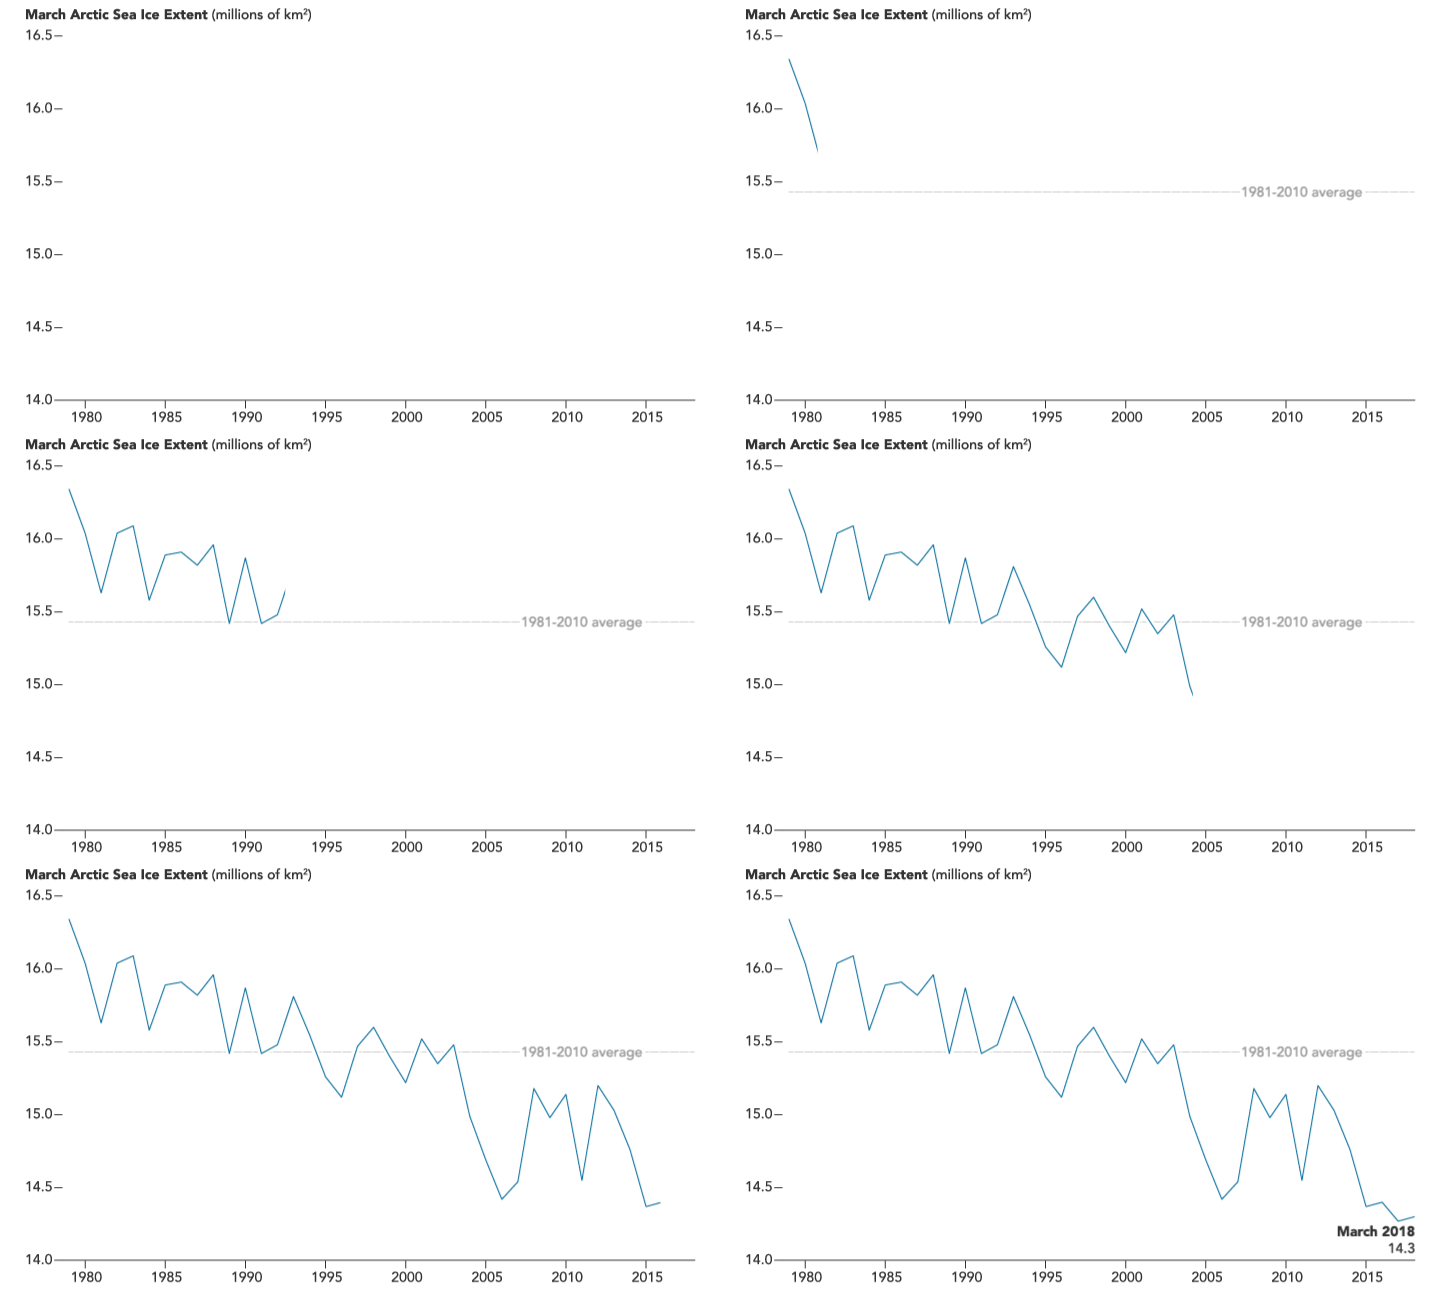
The map above shows the average concentration of Arctic sea ice on March 17, 2018, when it reached the annual maximum. All white-shaded areas had an ice concentration of at least 15 percent (the minimum at which satellites give a reliable measurement), and span a total area that scientists refer to as the “ice extent.” Ice cover peaked at 14.48 million square kilometers (5.59 million square miles), the second lowest maximum on record and 1.16 million square kilometers (448,000 square miles) below the 1981 to 2010 average. The animated line plot below shows Arctic sea ice extent in every March since 1979.

The effects of declining sea ice have rippled throughout the Arctic region and the world. Plants, animals, plankton, and people are being forced to adapt to warmer summers and winters and to more open water. Atmospheric and ocean-circulation patterns are also changing, moving the jet streams and stirring up unusual weather in the high- and mid-latitudes.
The disappearing ice is also changing the shipping industry. In August 2017, a newly designed tanker with a hardened hull became the first merchant ship to sail across the Arctic Ocean without the aid of an icebreaker. The Christophe de Margerie traveled from Norway to South Korea in 19 days, nearly a week faster than the traditional trip through the Mediterranean and the Suez Canal.
It took just six months to top that feat. In February 2018, a tanker carrying liquid natural gas (the Eduard Toll) cruised through mid-winter ice cover from South Korea to Sabetta terminal (northern Russia) to France.

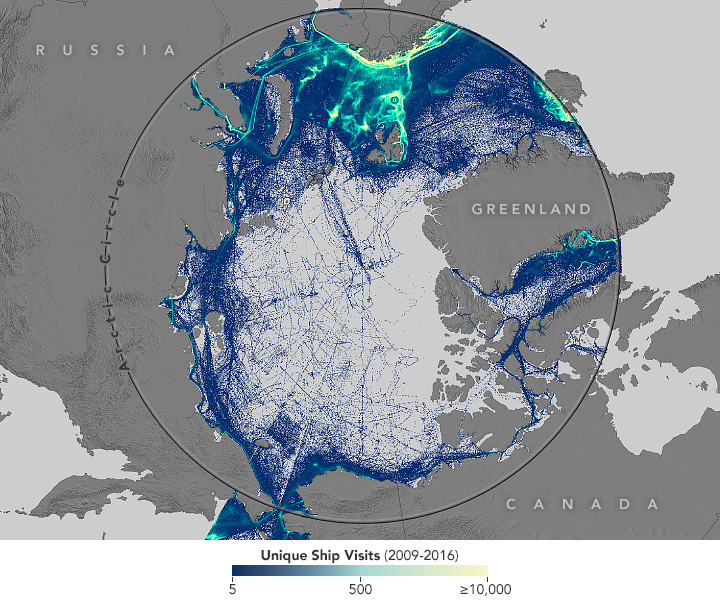
This map shows unique ship visits to Arctic waters between September 1, 2009, and December 31, 2016. Dots and lines represent the locations of ships as transmitted by shipboard beacons to satellite receivers. The denser and brighter the coloring of the dots, the greater the number of distinct ship transits reported in that region, with bright yellow and green representing areas with the highest traffic.
The map was created through a collaboration led by Paul Arthur Berkman, director of the science diplomacy center at Tufts University, and Greg Fiske, a geospatial analyst at the Woods Hole Research Center. The team mapped and analyzed more than 120 million data points compiled by SpaceQuest, a company that designs microsatellites that can monitor the track Automatic Identification System (AIS) signals from ships.
Berkman, Fiske, and colleagues have found that the mean center of shipping activity moved 300 kilometers north and east—closer to the North Pole—over the 7-year span. They were particularly surprised to find more small ships, such as fishing boats, wading farther into Arctic waters. The team also plotted the AIS ship tracks against sea ice data from NSIDC and found that ships are encountering ice more often and doing so farther north each year.
Russia, China, Canada, the United States, and Iceland are leading a flotilla of nations preparing for more shipping activity in the Arctic. The Northwest Passage through Canada and the Northern Sea Route, or Northeast Passage, north of Russia and Siberia are both valued because they could significantly shorten ship transit times between Asia, Europe, and North America. But scientists and environmental advocates have serious concerns about pollution, oil spills, and disturbances to marine life, among other possible impacts. Then there is the danger to the lives of sailors plying icy waters with poor navigation charts.
Berkman is the coordinator and lead investigator of Pan-Arctic Options, an interdisciplinary, international effort to “synthesize natural and social science research, leverage future scenario planning activities, and create geospatial maps, building common interests with practical governance options (without advocacy) that will promote sustainable development of the Arctic.” The group of researchers and policy specialists provides objective information that can guide the placement of infrastructure and the management of activities such as search and rescue and pollution response.
Whether open Arctic water is a boon for shipping, it remains bad news for the Arctic environment as we have known it. “Arctic sea ice cover continues to be in a decreasing trend, and this is connected to the ongoing warming of the Arctic,” said Claire Parkinson, a climate scientist at NASA’s Goddard Space Flight Center. “It’s a two-way street: the warming means less ice is going to form, and more ice is going to melt. But also, because there is less ice, less of the Sun’s radiation is reflected off of Earth, and this contributes to the warming.”
NASA Earth Observatory images (sea ice concentration and extent) by Joshua Stevens, using data from the National Snow and Ice Data Center. Ship traffic map provided by Greg Fiske, Woods Hole Research Center. Funding for the ship traffic analyses is provided by the National Science Foundation (NSF-OPP 1263819 and NSF-ICER 1660449). Story by Mike Carlowicz.