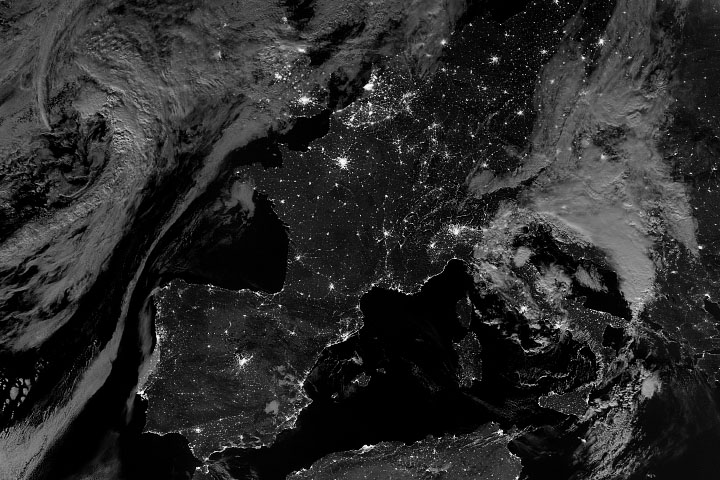
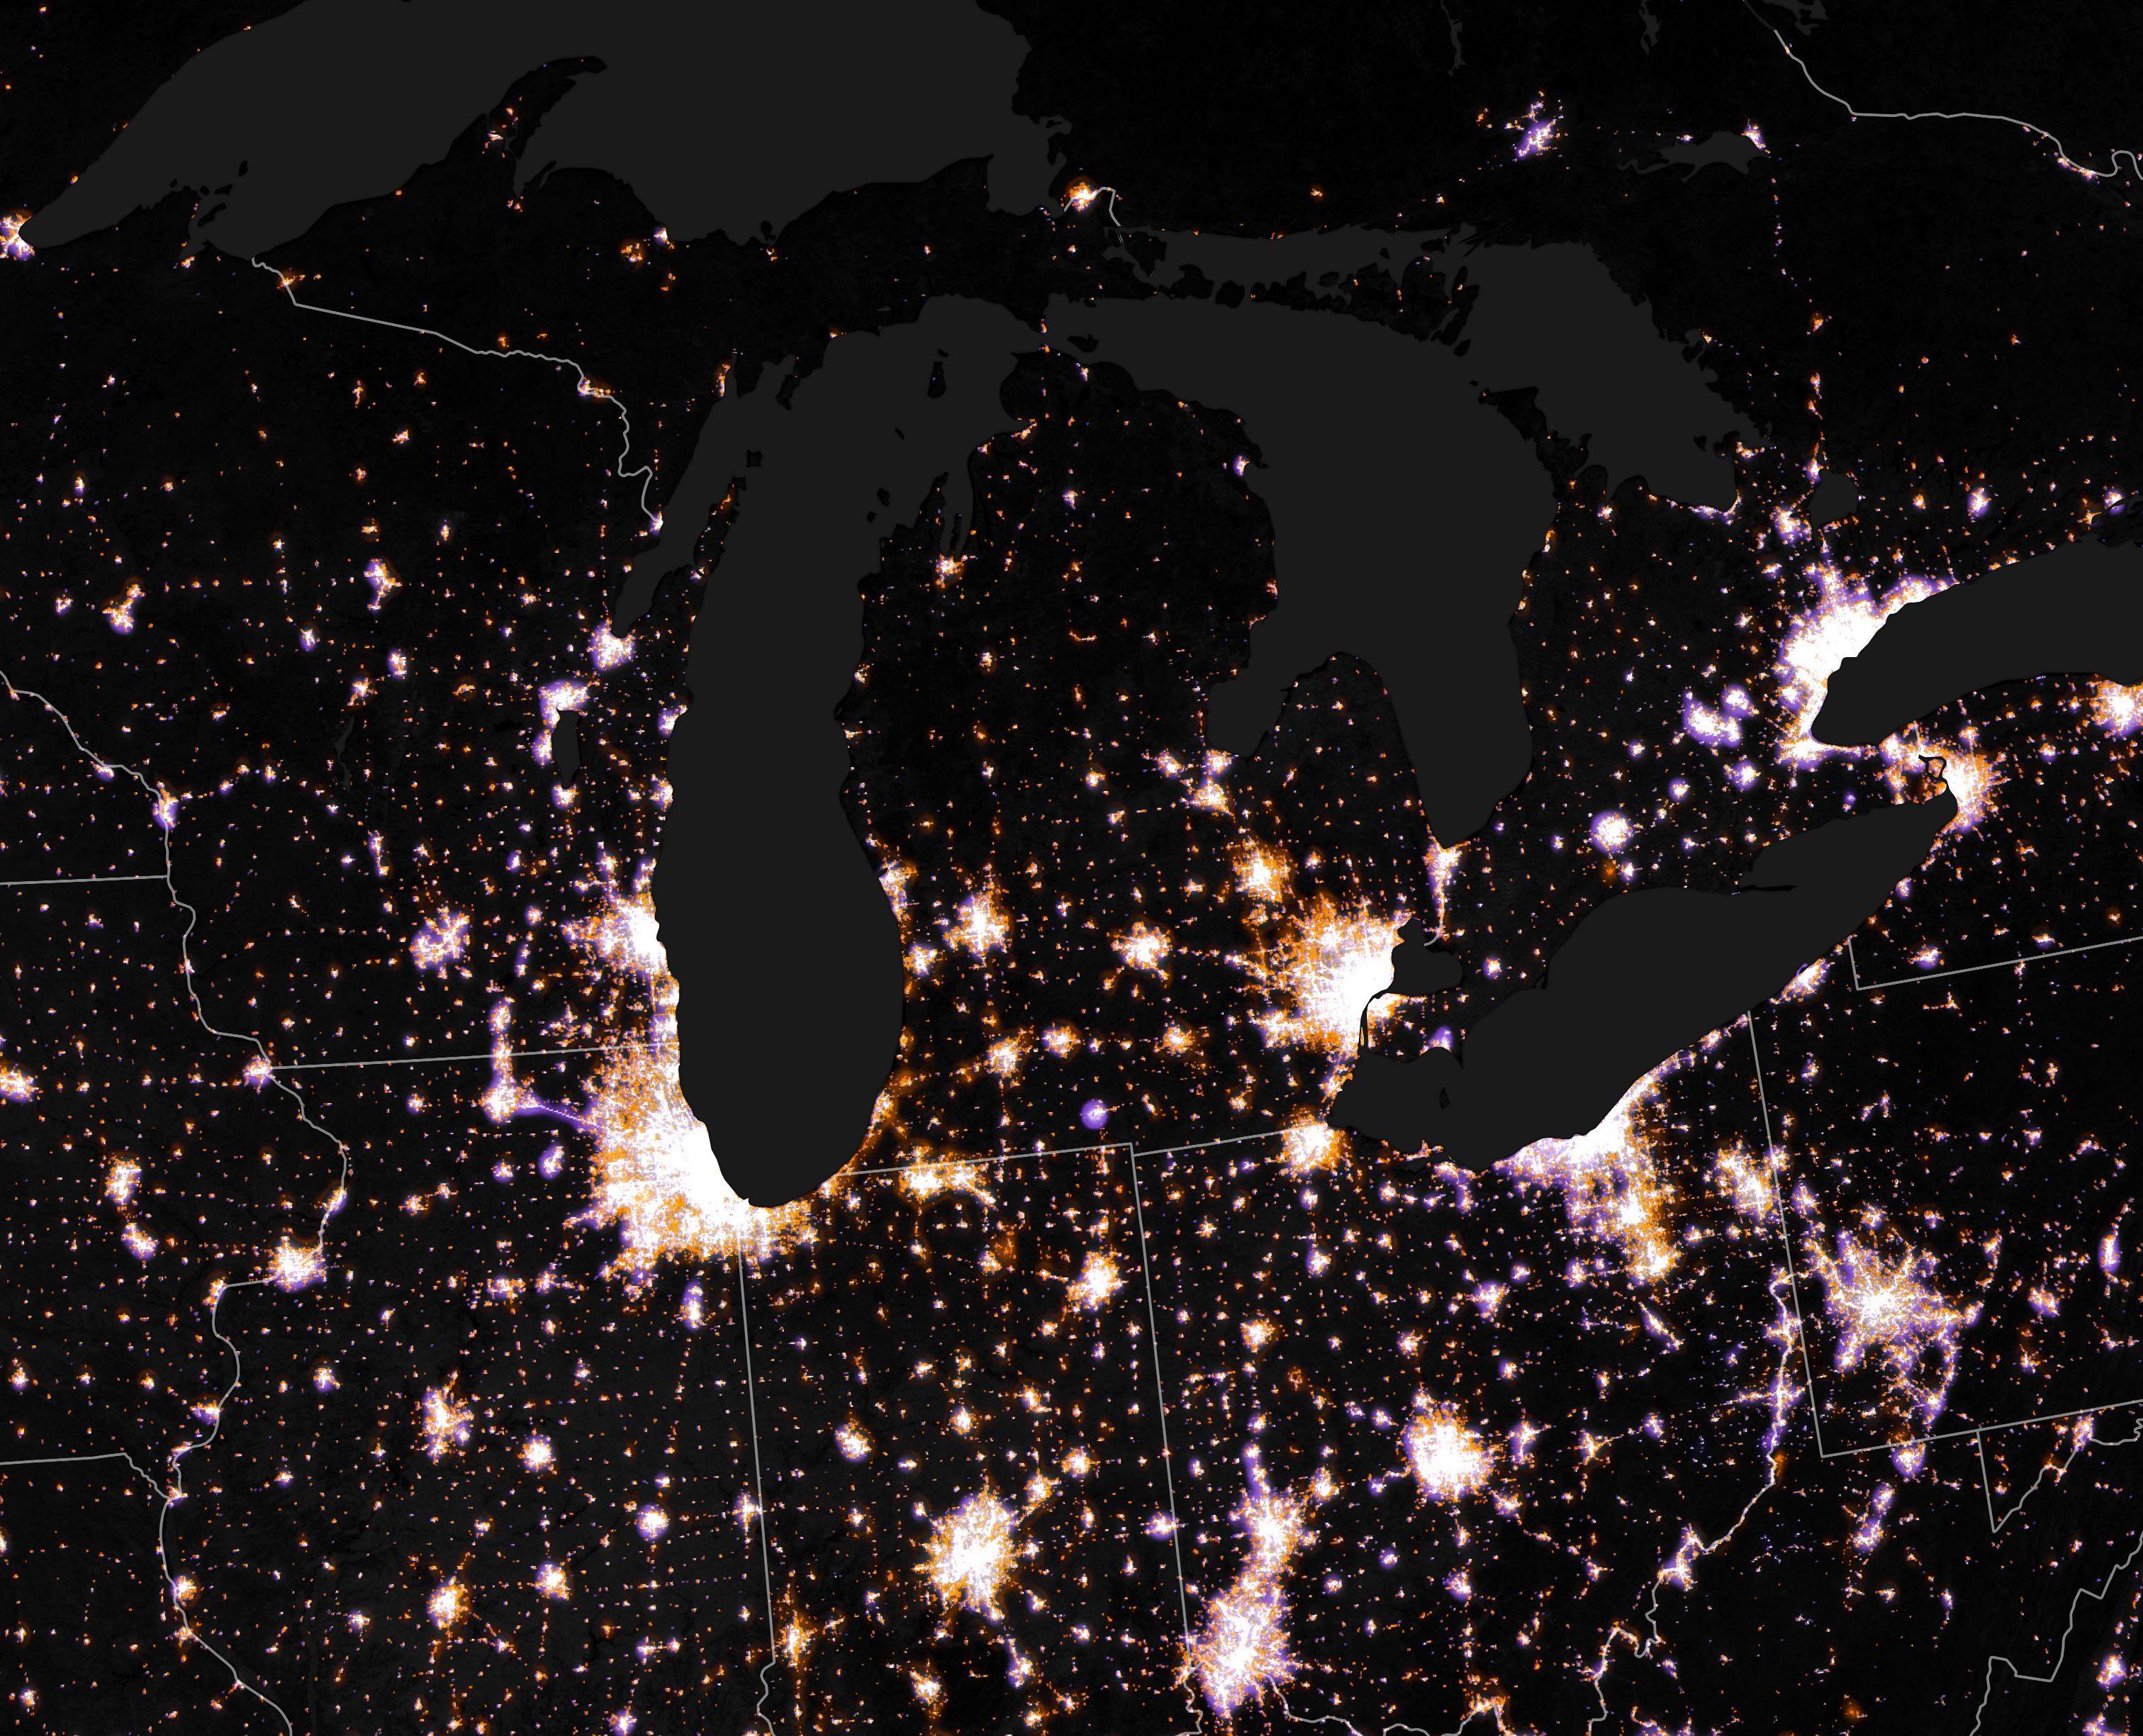
Since 2011, the Visible Infrared Imaging Radiometer Suite (VIIRS) sensor on the Suomi NPP satellite has been collecting data on the brightness of lights—natural and manmade—that shine around the Earth at night.
Suomi NPP’s orbit allows VIIRS to collect new night light data for almost all of the Earth every night. This means the sensor does much more than generate pretty pictures. With each orbit, it adds to an ever-growing archive of data that is allowing scientists and geographers to track changes in artificial lights, fishing practices, economic activity, development patterns, the movement of goods and people, and many other research areas in innovative ways and on a global scale.
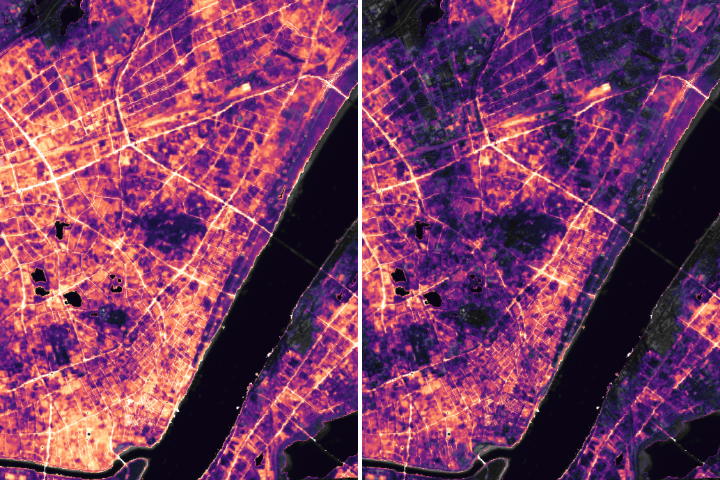
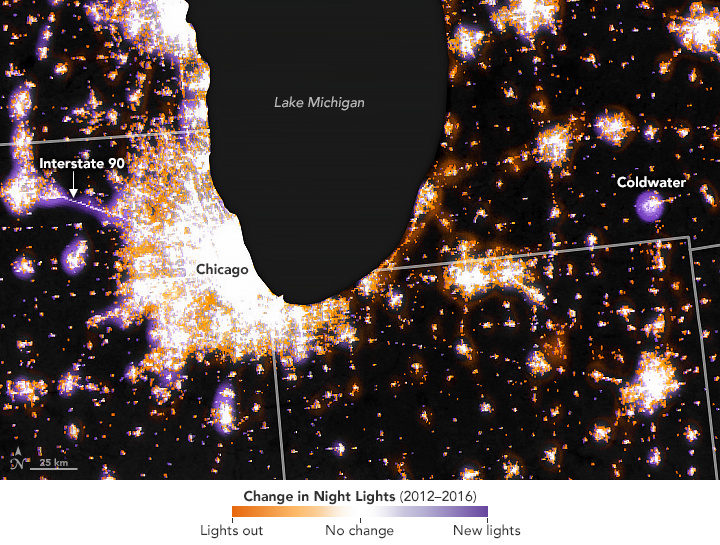
The map above offers a few small-scale examples of the sort of changes that VIIRS can reveal. The map shows where the intensity of light decreased (orange), increased (purple), and stayed the same (white) between 2012 and 2016 in the Midwest. In order to make the map, all of the clear-sky imagery collected by VIIRS in 2012 was compiled into a composite and then compared to a composite of clear images from 2016.
The marked increase in light along Interstate 90 between Chicago and Rockford, as well as the increase in light around the town of Coldwater, Michigan, are two of the more noticeable features. The new light along the highway is associated with a multi-year infrastructure project to widen the road. In 2013 and 2014, the western portion of this stretch of I-90 was expanded from two to four lanes; the eastern portion went from six to eight lanes between 2014 and 2016.
In Coldwater, Michigan, the increase in light relates to the recent construction of greenhouses that are used to raise vegetables using hydroponic growing techniques. Despite Michigan’s dark and chilly winters, the high-tech greenhouses are equipped with powerful grow lights that are often lit at night, making it possible to raise tomatoes and peppers 365 days a year.
Many small, local changes in lighting like these can point to big changes in energy use, light pollution, and economic development over time. However, scientists—as well as the public—should be careful when interpreting the changes they see in qualitative maps of changing nighttime light, cautioned Miguel Román, a scientist at NASA’s Goddard Space Flight Center. There are several natural factors that can influence how much light the satellite detects, ranging from the phase of the Moon, lightning flashes, the presence or absence of snow or vegetation, and haze and cloud cover. These issues need to be fully understood when analyzing changes in light over time. Snow can be particularly problematic because its presence can amplify light signals even when skies are perfectly clear.
“Some of the changes you see in this map have more to do with differences in snow cover than with changes to lights on the ground,” said Román. “However, along that part of I-90 and around Coldwater, the signal is quite strong. We have checked enough on the day-to-day and week-to-week light levels—not just whole years of data averaged together, as this map shows—that I am confident the increases are real in those two places.”
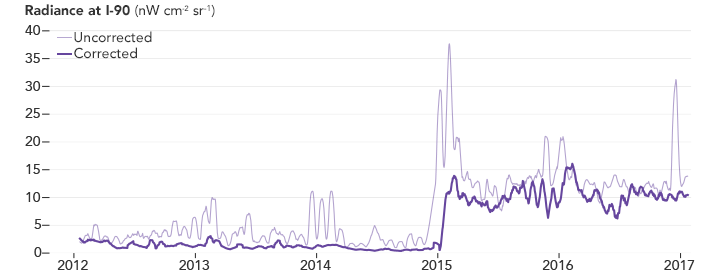
The time-series chart above provides a more complete look at how the intensity of the light VIIRS detected along I-90 changed between 2012 and 2016. The uncorrected values observed by the satellite are shown in light purple. In the corrected data, shown in dark purple, algorithms developed by Román and his colleagues have filtered out changes caused by moonlight, snow, and other natural factors as much as possible.
Notice that the corrected data shows a sizable—roughly tenfold—increase in light in the beginning of 2015, a clear sign that new lighting associated with the highway project came online at that time. The small peaks and valleys in the uncorrected data are associated with changes in moonlight. The steeper peaks and valleys are caused by snow amplifying the light signal. The amplification can be significant. Note that light levels went up roughly 30-fold in 2015 in the uncorrected data, but that roughly two-thirds of the increase was due to the signal being amplified by snow, explained Román.
As time passes and more satellite data accumulates, expect to see scientists and geographers digging deeply into VIIRS data. For the past few decades, researchers have been mining an earlier generation of night light data acquired by the Operational Linescan System (OLS), which operated on weather satellites managed by the U.S. Department of Defense. “Since VIIRS is about ten to fifteen times better than the OLS at resolving the relatively dim lights of human settlements, I expect there will be even stronger interest in doing time-series analysis for VIIRS,” said Román. “It’s an exciting time to be doing this type of research.”
NASA Earth Observatory images by Joshua Stevens, using Suomi NPP VIIRS data from Miguel Román, NASA GSFC. Story by Adam Voiland.