Every year, the process is generally the same: the cap of sea ice on the Arctic Ocean melts and retreats through spring and summer to an annual minimum extent. Then, as the ocean and air cool with autumn, ice cover grows again and the cycle continues. But when we take a look at smaller regions within the Arctic, we get a more detailed picture of what’s been going on.
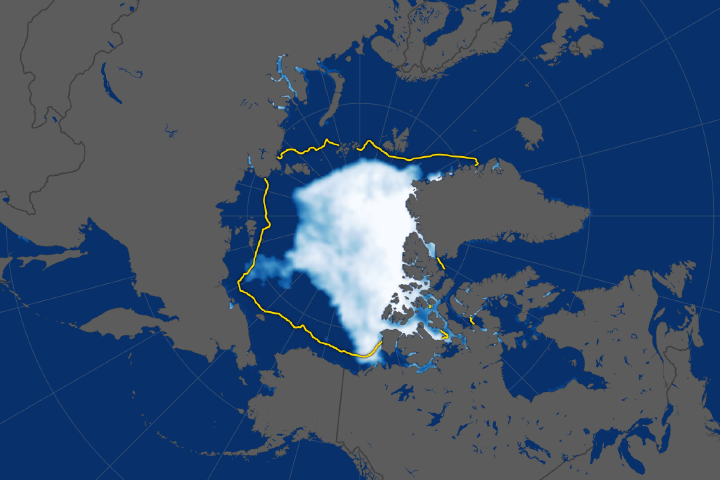
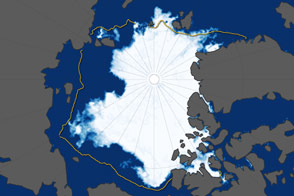
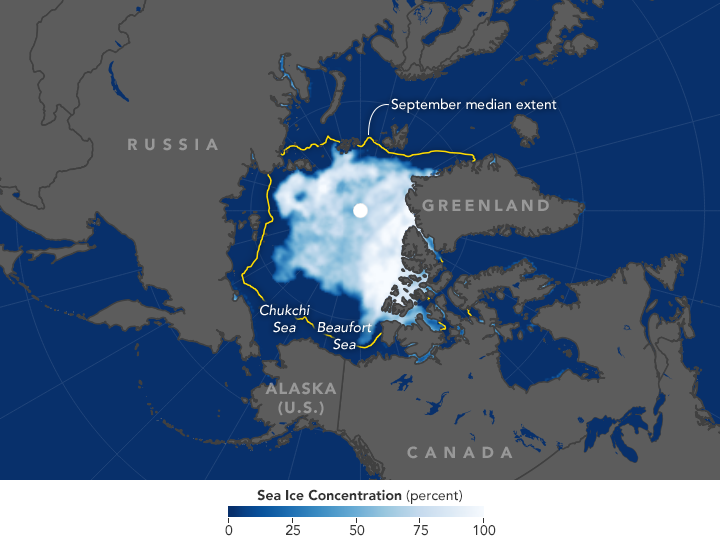
The map above shows the extent of Arctic sea ice on September 13, 2017, when the ice reached its minimum extent for the year. Extent is defined as the total area in which the ice concentration is at least 15 percent. The map was compiled from observations by the Advanced Microwave Scanning Radiometer 2 (AMSR-2) sensor on the Global Change Observation Mission 1st-Water satellite operated by the Japan Aerospace Exploration Agency (JAXA). The yellow outline shows the median sea ice extent observed in September from 1981 through 2010.
According to the National Snow and Ice Data Center, Arctic sea ice cover in 2017 shrank to 4.64 million square kilometers (1.79 million square miles), the eighth-lowest extent in the 39-year satellite record. Charting these annual minimums and maximums has revealed a steep decline in overall Arctic sea ice in the satellite era. But the decline is not the same everywhere across the Arctic Ocean. The Beaufort Sea north of Alaska, for example, is the region where sea ice has been retreating the fastest.
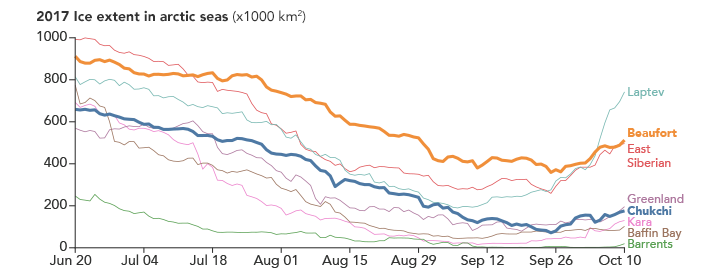
This year, ice in the Chukchi and Beaufort and seas reached their minimum extents toward the end of September, later than the Arctic as a whole. The graph above shows the ice in these two seas was still declining while other regions had started freezing. The melting persisted the longest in the Beaufort Sea, which finally started to refreeze after reaching a minimum on September 27. Data for the graph come from the NSIDC Multi-sensor Analyzed Sea Ice Extent (MASIE) product, which is based on operational sea ice analyses produced by the U.S. National Ice Center.
Ice loss is the Beaufort and Chukchi seas was not record-breaking this year, but the extents were much lower than usual. Notice in the map how the ice edge in these seas was farther north than average. According to Walt Meier, a scientist at the National Snow and Ice Data Center, the Chukchi and Beaufort seas entered the melt season with a lot of first-year ice. This ice type is generally thinner than multi-year or perennial ice (which survived the previous melt season); first-year ice tends to melt away more easily.
Meier also notes that low-pressure weather systems persisted near the North Pole for much of the summer. “Low pressure will keep things cooler overall and generally will lead to a relatively higher ice extent overall,” Meier said. “However, the position of the low this year led to winds blowing from the south and west that help move ice out of these regions. Also, the winds may have helped to bring in warmer ocean waters from the Bering Strait region as well.”
NASA Earth Observatory images by Joshua Stevens, using data from the National Snow and Ice Data Center. Story by Kathryn Hansen.