In March 2017, Arctic sea ice reached a record-low maximum extent, according to scientists at NASA and the National Snow and Ice Data Center (NSIDC). In the same month, sea ice on the opposite side of the planet, around Antarctica, hit its lowest extent ever recorded at the end of the austral summer—a surprising turn of events after years of moderate sea ice expansion.
On February 13, 2017, the combined Arctic and Antarctic sea ice numbers were at their lowest point since satellites began to continuously measure sea ice in 1979. Total polar sea ice covered 16.21 million square kilometers (6.26 million square miles), which is 2 million square kilometers (790,000 square miles) less than the average global minimum extent for 1981–2010. That’s the equivalent to losing a chunk of sea ice larger than Mexico.
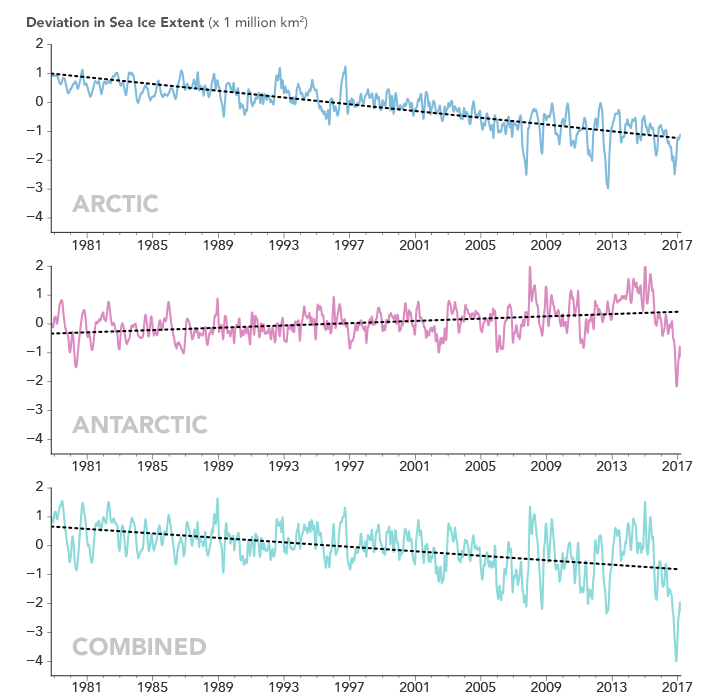
The line graphs above plot the monthly deviations and overall trends in polar sea ice from 1979 to 2017 as measured by satellites. The top line shows the Arctic; the middle shows Antarctica; and the third shows the global, combined total. The graphs depict how much the sea ice concentration moved above or below the long-term average. (They do not plot total sea ice concentration.)
Arctic and global sea ice totals have moved consistently downward over 38 years. Antarctic trends are more muddled, but they do not offset the great losses in the Arctic. The maps below give a closer look at the record lows that occurred at each pole this year.
The ice floating on top of the Arctic Ocean and its surrounding seas shrinks from mid-March until mid-September. As the Arctic temperatures drop in the autumn and winter, the ice cover grows again until it reaches its yearly maximum extent, typically in March. This winter, a combination of warmer-than-average temperatures, unfavorable winds, and a series of storms stunted sea ice growth in the Arctic.
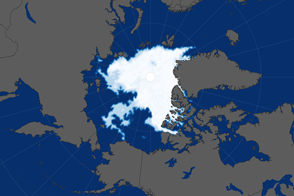
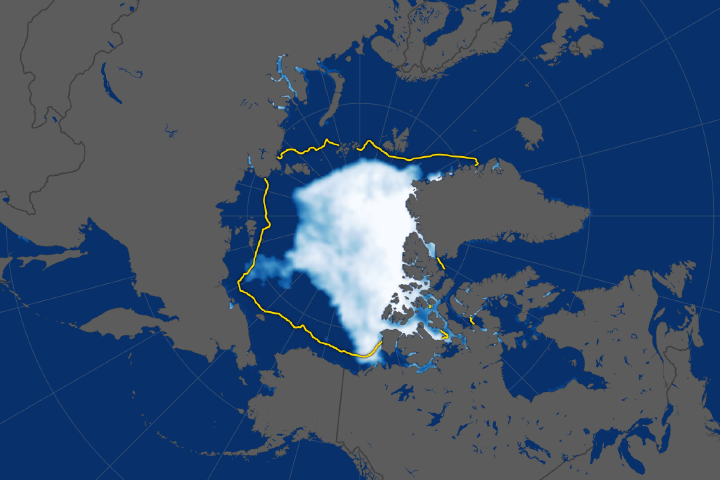
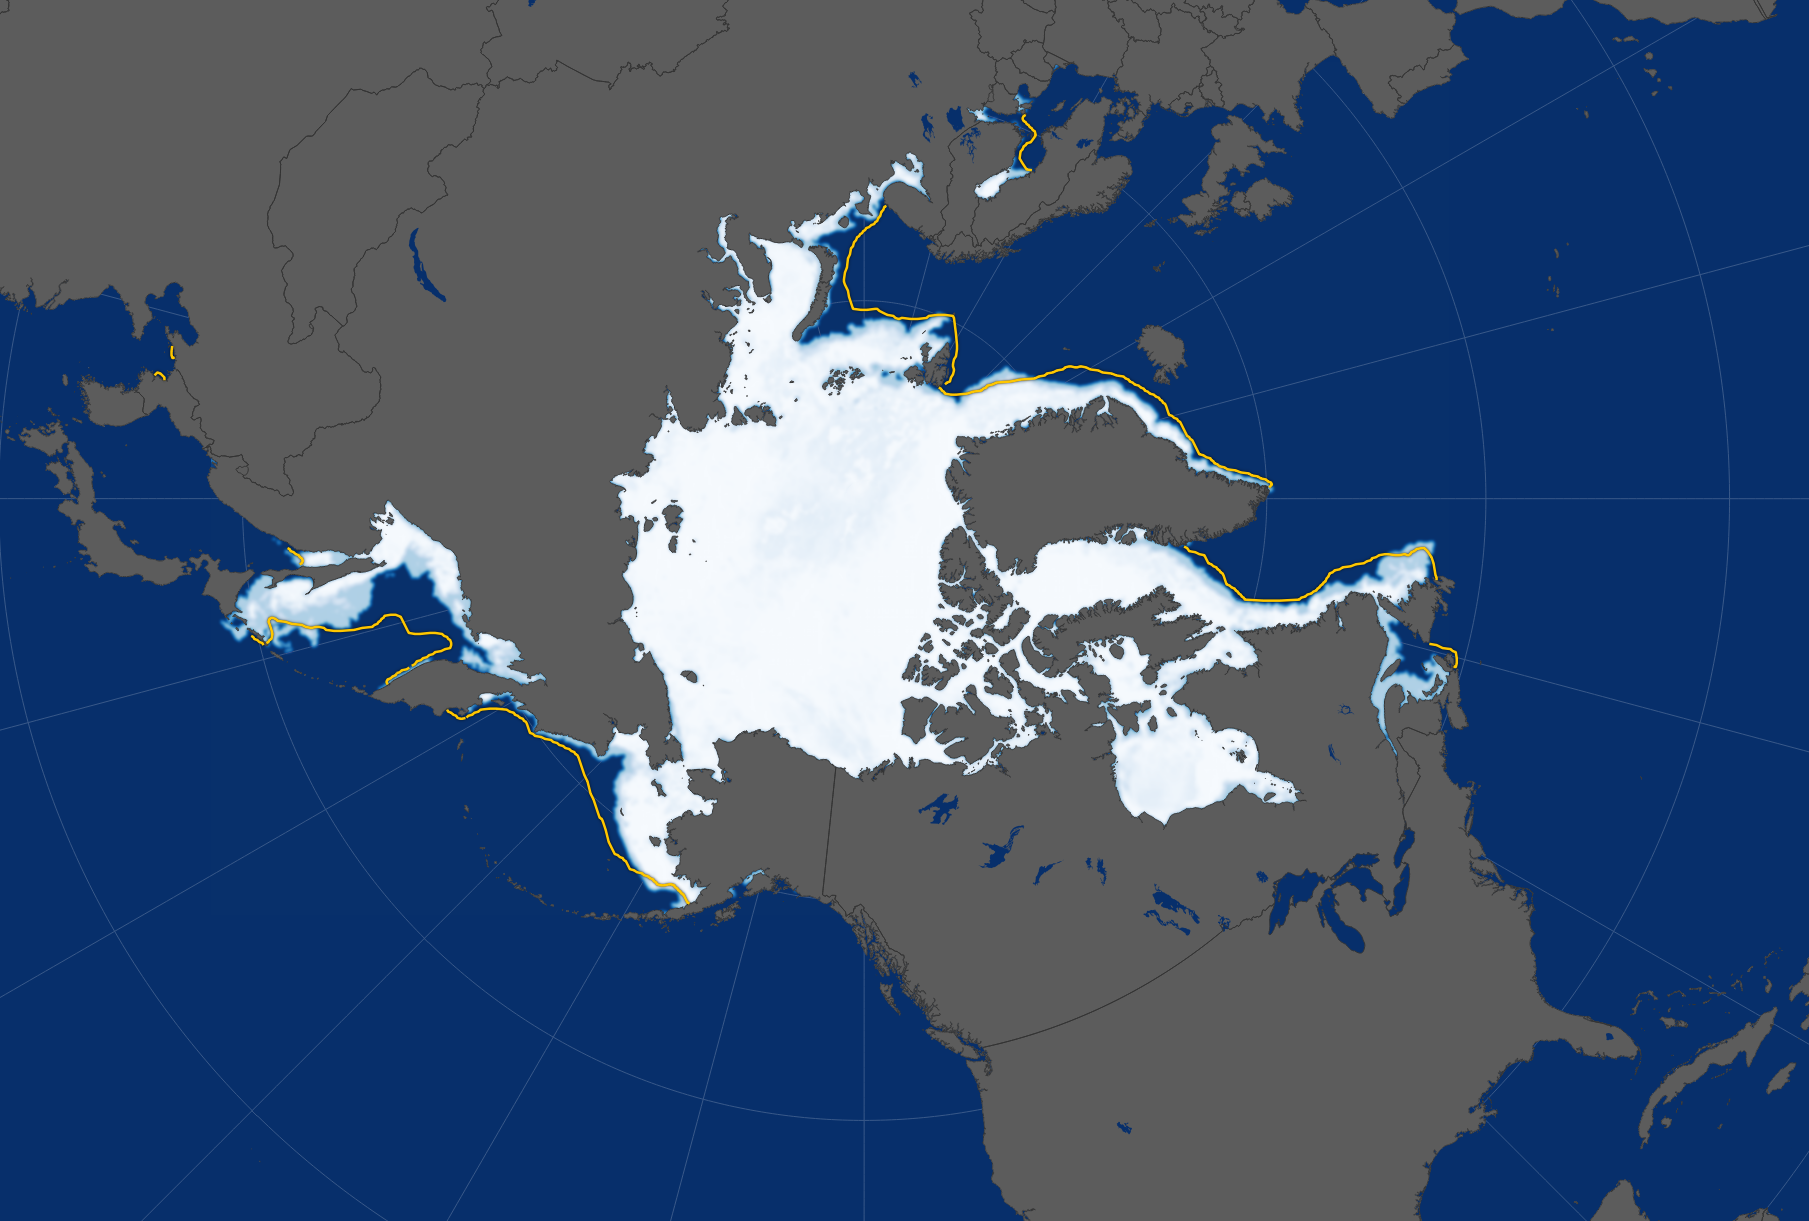
The first map shows the concentration of Arctic sea ice on March 7, 2017, when it reached its maximum extent for the year. Opaque white areas indicate the greatest concentration, and dark blue areas are open water. All icy areas pictured here have an ice concentration of at least 15 percent (the minimum at which space-based measurements give a reliable measurement), and cover a total area that scientists refer to as the “ice extent.”
The maximum extent on March 7 was a record low, measuring 14.42 million square kilometers (5.57 million square miles). That’s 97,00 square kilometers (37,000 square miles) below the previous record low that occurred in 2015.
“We started from a low September minimum extent,” said Walt Meier, a sea ice scientist at NASA’s Goddard Space Flight Center. “There was a lot of open ocean water, and we saw periods of very slow ice growth in late October and into November because the water had a lot of accumulated heat that had to be dissipated before ice could grow. The ice formation got a late start and everything lagged behind—it was hard for the sea ice cover to catch up.”
This year’s record-low maximum will not necessarily lead to a new record-low minimum extent in summertime, since weather has a great impact on the melt season’s outcome, Meier said. “But it’s guaranteed to be below normal.”
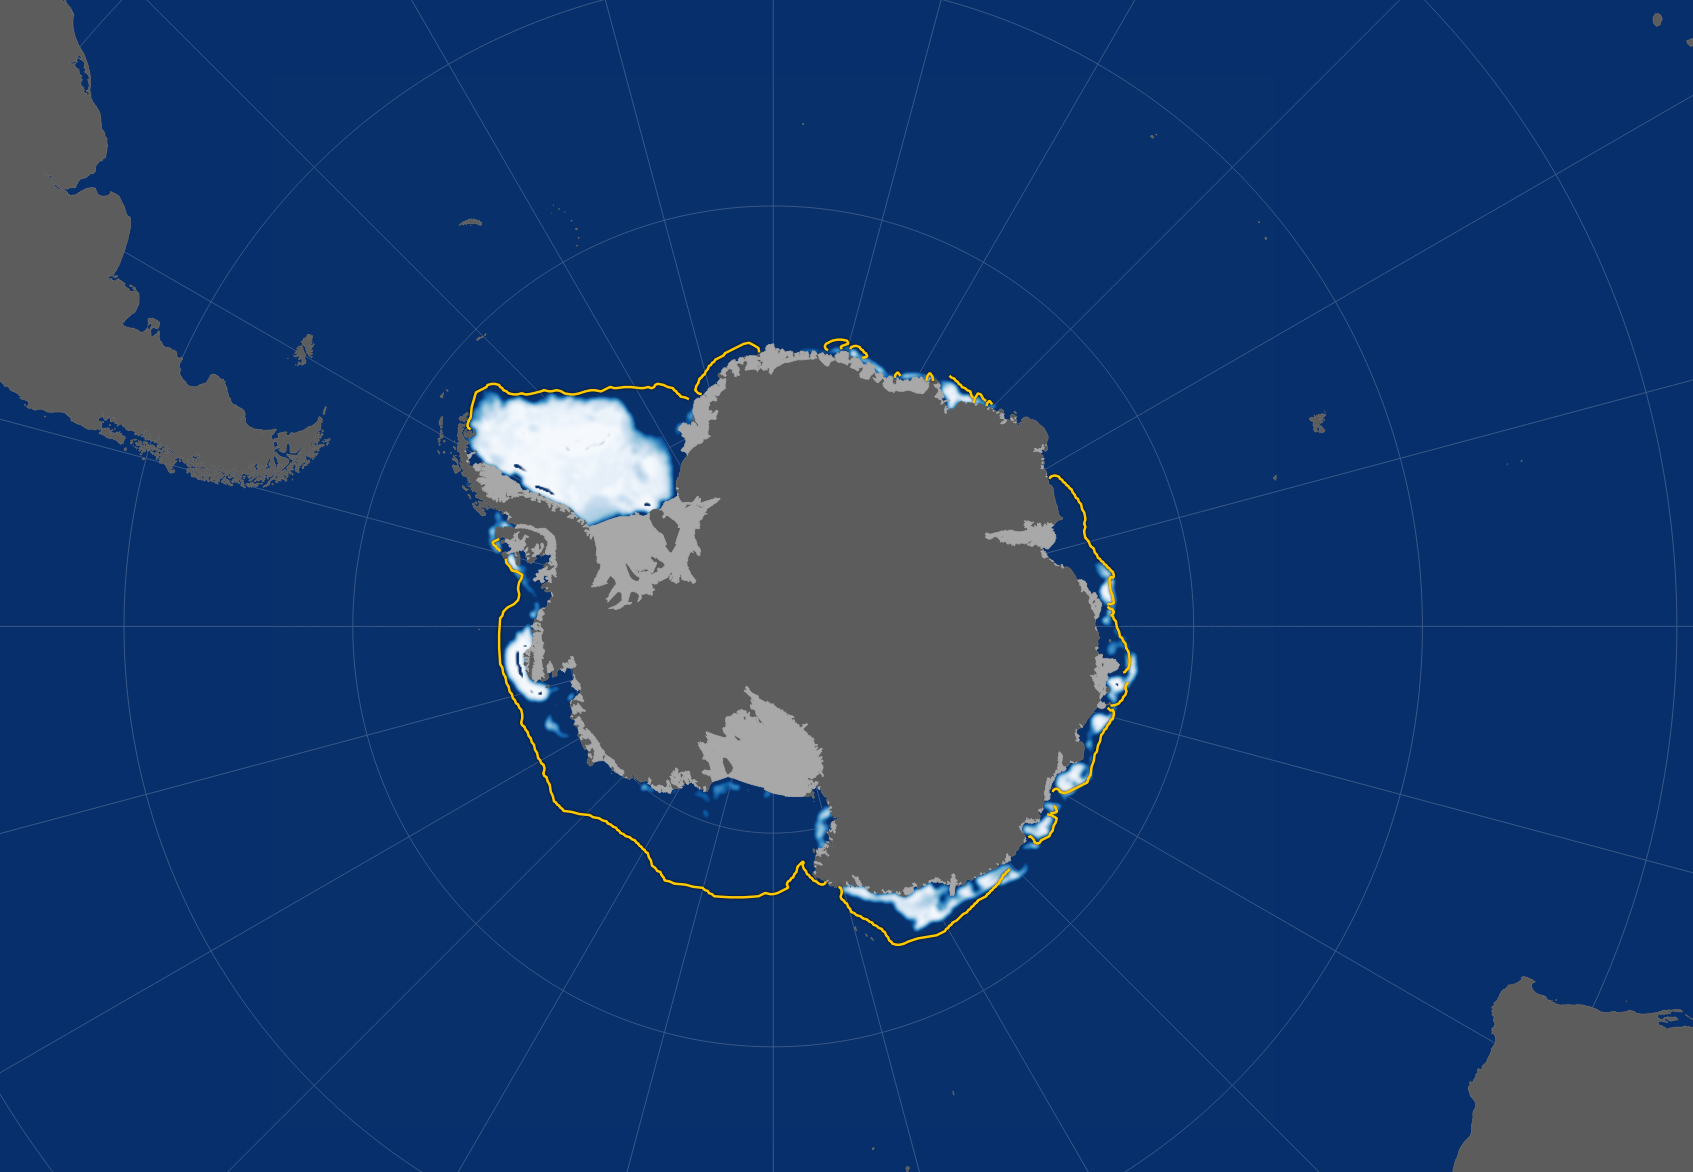
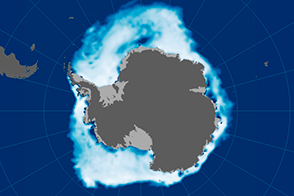
Sea ice around Antarctica behaves in a similar manner, but with the calendar flipped—it usually reaches its maximum in September and its minimum in February. This year, Antarctic sea ice reached a record-low minimum on March 3. The second map shows the concentration of sea ice on that day.
The extent on March 3 measured 2.11 million square kilometers (815,000 square miles). That’s 184,000 square kilometers (71,000 square miles) below the previous record low in the satellite record, which occurred in 1997. This year’s low happened just two years after several monthly record-high extents in Antarctica and decades of moderate sea ice growth.
“There’s a lot of year-to-year variability in both Arctic and Antarctic sea ice, but overall, until last year, the trends in the Antarctic for every single month were toward more sea ice,” said Claire Parkinson, a senior sea ice researcher at NASA Goddard. “Last year was stunningly different, with prominent sea ice decreases in the Antarctic. To think that now the Antarctic sea ice extent is actually reaching a record minimum, that’s definitely of interest.”
Meier said it is too early to tell if this year marks a shift in the behavior of Antarctic sea ice.
“It is tempting to say that the record low we are seeing this year is global warming finally catching up with Antarctica,” Meier said. “However, this might just be an extreme case of pushing the envelope of year-to-year variability. We’ll need to have several more years of data to be able to say there has been a significant change in the trend.”
NASA Earth Observatory images by Joshua Stevens, using data from the Advanced Microwave Scanning Radiometer 2 (AMSR2) sensor on the Global Change Observation Mission 1st-Water (GCOM-W1) satellite and the Scanning Multichannel Microwave Radiometer (SMMR) on the Nimbus-7 satellite. Caption by Maria-José Viñas, adapted for Earth Observatory by Kathryn Hansen.