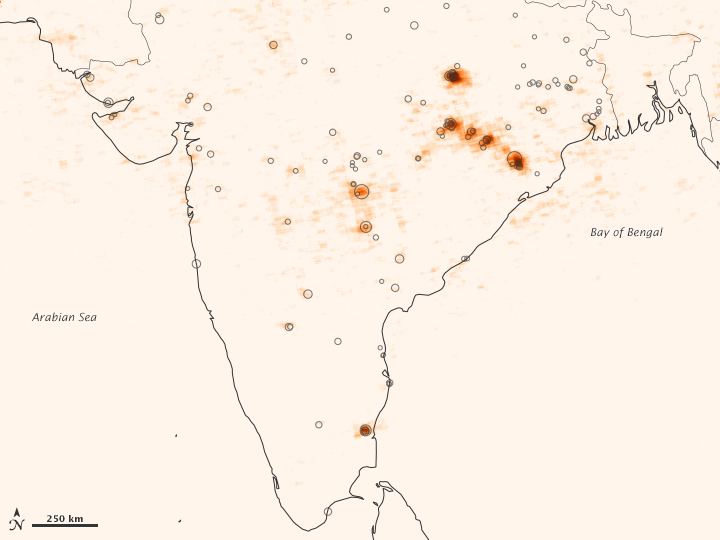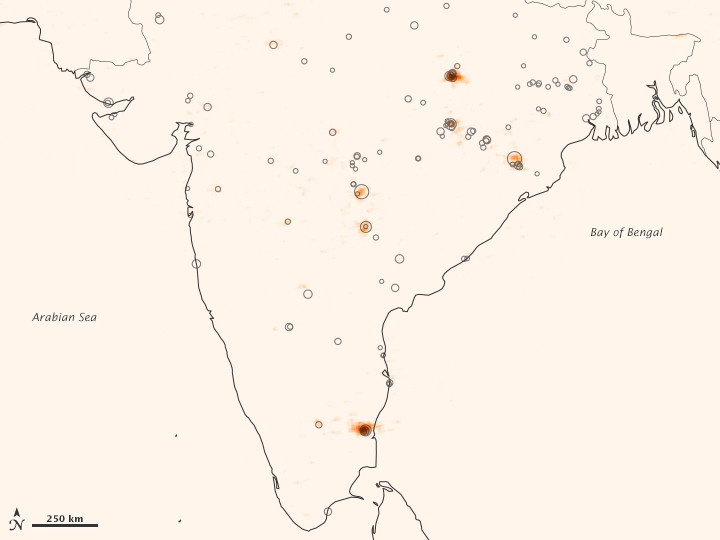


Emissions of sulfur dioxide from power plants in India increased by more than 60 percent between 2005 and 2012 according to new analysis of data from NASA’s Aura satellite. Led by Zifeng Lu of Argonne National Laboratory, the study was published online on December 5, 2013, in Environmental Science & Technology.
Sulfur dioxide (SO2) is an atmospheric pollutant with both health and climate impacts. In 2010, India surpassed the United States as the world’s second highest emitter of SO2 (after China), according to estimates previously published by Lu and other scientists from universities and the U.S. Environmental Protection Agency. The same research showed that about half of India’s emissions came from the coal-fired power sector.
The maps above depict sulfur dioxide concentrations in 2011-12 (top) and 2005 (lower) and the relative size of power plants in India. Darker shades of orange-brown depict greater concentrations of SO2 in the atmosphere, while the size of the circles indicates the amount of emissions from the local power plant smoke stacks. Turn on the image comparison tool for a better look at the difference. You can also download maps of measurements for each year between 2005 and 2012.
While some atmospheric SO2 is produced by volcanoes and other natural processes, a substantial amount is produced by human activities such as the combustion of fuels with sulfur-containing impurities and the smelting of metals such as copper and nickel. The gas contributes to the formation of acid rain and, in high concentrations, can cause respiratory problems. It is also a precursor for sulfate aerosols, a type of suspended particle that can affect the properties of clouds—an effect that is difficult to measure and remains a large point of uncertainty in climate models.
India’s Central Pollution Control Board noted in a 2012 report that the national mean concentration of sulfur dioxide had declined from 2001 to 2010, an estimate based on data from ground-based monitoring stations. However, most of the stations are located in urban areas, where regulations have indeed reduced pollution locally. Only some of the stations in India collect measurements near the source of power plant emissions.
“We should know the air quality not only in populated cities, but also in industrial areas, where coal-fired power plants truly dominate national sulfur dioxide emissions,” said Lu. “On the one hand, local residents are influenced by these emissions. On the other hand, long-lifetime, sulfur-containing air pollutants such as sulfate can be transported long distances to affect public health and the environment at a regional scale.”
The new analysis of sulfur dioxide emissions comes two years after researchers developed a method to observe power plant emissions using measurements captured by an instrument on the Aura satellite. The Ozone Monitoring Instrument (OMI) measures ozone and other key air quality components (including sulfur dioxide and nitrogen dioxide) and collects data over the same locations at the same time daily.
Using OMI’s eight-year record of observations, Lu and colleagues averaged measurements of sulfur from 65 power plants in 23 regions. Over time, a pattern emerged that allowed scientists to distinguish nearly constant power plant emissions from more variable background concentrations of sulfur dioxide. Researchers used OMI data and the same technique in a 2011 study to show that sulfur dioxide emissions from large U.S. coal-fired power plants fell from 2005-2007 to 2008-2010.
“This paper confirms that a technique shown to work in the United States can be applied for other countries where emissions [from ground-based measurements] are not well known,” said co-author Nickolay Krotkov of NASA’s Goddard Space Flight Center.
NASA images created by Jesse Allen, using data provided by Zifeng Lu (Argonne National Laboratory). Caption by Kathryn Hansen, NASA Earth Science News Team, with Mike Carlowicz, NASA Earth Observatory. This research was sponsored by NASA as part of the Air Quality Applied Sciences Team (AQAST) program.