

Like most of the world’s cities, Beijing has a pollution problem, and among the most common pollutants are nitrogen oxides, gases that contain nitrogen and oxygen. Cars, buses, power plants, factories, and homes all pump nitrogen oxides into the atmosphere when they burn fuel at high temperatures. The resulting gas hangs over the city in an ugly red-brown haze. By themselves, nitrogen oxide gases can make breathing difficult, particularly for very young, elderly, or asthmatic people, but they are also one of the primary ingredients in another choker: ground level ozone or smog. Nitrogen oxides can combine with water to form acid rain, which damages cars, buildings, and water supplies, and some nitrogen oxides are greenhouse gases that contribute to global warming.
In an effort to control smog during the 2008 Olympics, Beijing officials planned to institute a number of pollution-curbing measures. One such measure is to limit the number of vehicles on the roads. The Summit of the Forum on China-Africa Cooperation, held in Beijing on November 4-5, 2006, gave officials the opportunity to see just how much pollution would be reduced if traffic were restricted. Between November 4 and November 6, officials banned government and commercial vehicles, restricted the use of private vehicles, and limited access to certain roads. Buses ran more frequently to provide transport within the city. News reports estimated that approximately 30 percent of the city’s vehicles were taken off the road during the three-day restriction period.
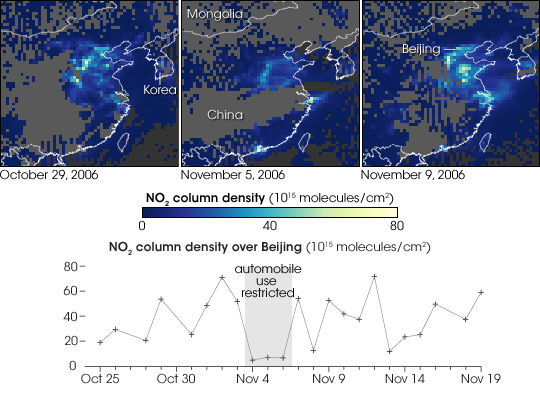
Orbiting overhead once a day, the Ozone Monitoring Instrument (OMI) on NASA’s Aura satellite recorded nitrogen dioxide levels. Looking through the column of air that sat between the satellite and the city, the instrument summed up the average number of nitrogen dioxide molecules per square centimeter. The data it sent back to Earth showed a drop in nitrogen dioxide levels over Beijing between November 4 and November 6, as illustrated by these images. High concentrations of nitrogen dioxide are represented by bright yellow squares over China’s major cities. The cities, and their corresponding pollution “hotspots” stretch across the North China Plain from north to south, with Beijing reigning in the north. On November 5, center, nitrogen dioxide levels dropped over the entire country, but the decrease is most dramatic over Beijing which went from turquoise-yellow (high) to dark blue (low) back to yellow before, during, and after the restriction period.
The graph illustrates the drop in nitrogen dioxide over Beijing in greater detail. Though concentrations jumped from day to day between October 25 and November 19, sometimes to concentrations as low as levels seen during the summit, the only time nitrogen dioxide levels remained below 20x1015 molecules per square centimeter for more than a single day was during the summit when traffic was restricted. The graph is from a paper by Yuxuan Wang and colleagues from Harvard University and the Royal Netherlands Meteorological Institute, published in Geophysical Research Letters on April 28, 2007. The scientists estimated that nitrogen oxide emissions were reduced by 40 percent during the restriction period.
NASA image created by Jesse Allen, using data provided courtesy of Yuxuan Wang, Harvard University and the Aura OMI Science Team.