The Earth Observatory has published its last Image of the Day on this website. Please join us on our new home at science.nasa.gov/earth/earth-observatory.

The coastal Pacific Northwest of the United States has the tallest trees in North America, averaging as much as 40 meters (131 feet) in height. It has the densest biomass—the total mass of organisms living within a given area—in the country. But for centuries, it also has been a much-tapped resource for lumber; land-clearing for agriculture and development have also trimmed the woodlands. Both the lumber companies and forest managers have an interest in measuring the health of these forests.
“Resource managers need to see forests down to the disturbance resolution—the scale at which parking lots or developments or farms are carved out,” says Josef Kellndorfer, an ecologist at the Woods Hole Research Center (WHRC). His research team recently took forest mapping down to that level when they released the National Biomass and Carbon Dataset (NBCD) in April 2011. “We are providing information on a management scale.”
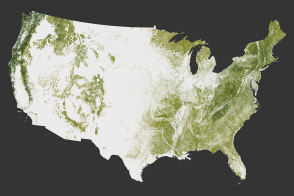
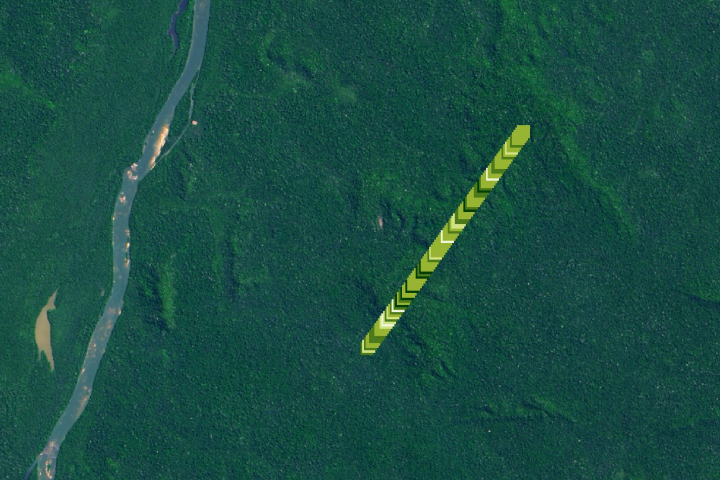
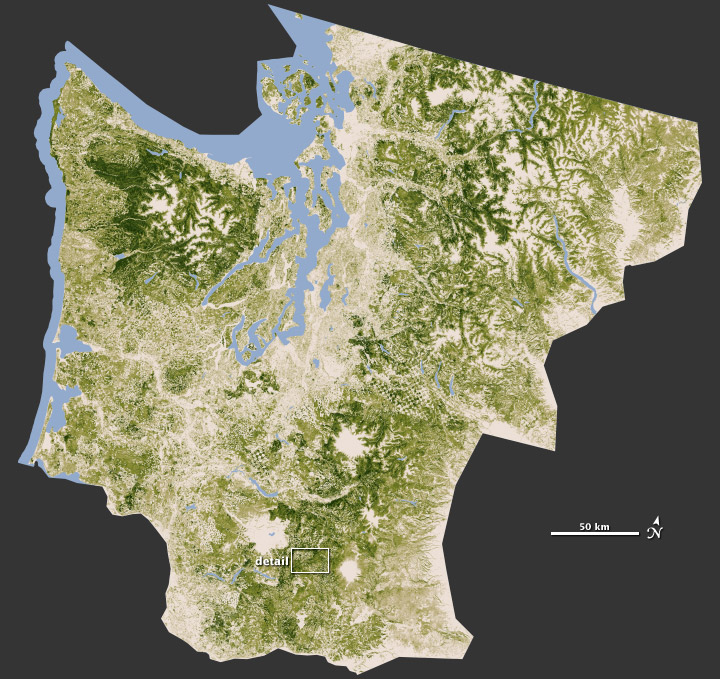
The maps above are a subset of that nationwide mapping project. The top map shows one of 66 mapping zones across the country; in this case, Washington state and a sliver of Oregon. The inset map (lower) shows the fine scale of that forest (the image is roughly 20 kilometers wide), which allows researchers to see the regular patterns of logging and development, and the more erratic shape of areas lost to fires and pests.
Over six years, researchers assembled the maps from space-based radar, satellite sensors, computer models, and a massive amount of ground-based data. Forests were mapped down to a scale of 30 meters, or roughly 10 computer display pixels for every hectare of land (4 pixels per acre). The colors depict the concentration of biomass stored in the trunks, limbs, and leaves of trees. The darkest greens reveal the areas with the densest, tallest, and most robust growth.
A rule of thumb for ecologists is that the amount of carbon stored in a tree equals 50 percent of its dry biomass. So if you can estimate the biomass of all the trees in the forest, you can estimate how much carbon is being stored. If you keep tracking it over time, you can know something about how much carbon is being absorbed from the atmosphere or lost to it.
Human activities have moved a lot of carbon from long-term, stable storage—such as the tall old-growth forests of the Pacific Northwest or the lower, denser stands of the Amazon—into forms with short-term, direct impacts on the environment. When we clear forests, we usually remove tall trees that can store tons of carbon in their trunks, branches, and leaves for hundreds of years. We replace them with croplands or pastures that store less carbon for a shorter time. And paved developments store little to no carbon.
In a recent report by the U.S. Forest Service, researchers noted that while the federal government owns slightly less than 50 percent of the forest land in the Pacific Northwest, it controls more then 67 percent of the old-growth in the region. That percentage is rising not because of new federal acquisitions, but because harvesting removed about 13 percent (491,000 acres) of old- and “late-sucessional” forest on non-federal lands. (The main reason for old-growth loss on federal lands is forest fire.)
“The biggest natural sink of terrestrial carbon lies in our forests and trees,” says Steve Running, a forest ecologist at the University of Montana. “And the biggest natural source of carbon on land is also the forest. So one of the most important things we can do for understanding the carbon budget is to get a better inventory of the carbon we have in our trees.”
To learn more about scientists' efforts to map the world's forests and how much carbon they store, read our latest feature story: Seeing Forests for the Trees and the Carbon: Mapping the World’s Forests in Three Dimensions.
Map by Robert Simmon, based on data from Woods Hole Research Center. Caption by Mike Carlowicz.