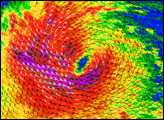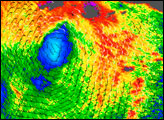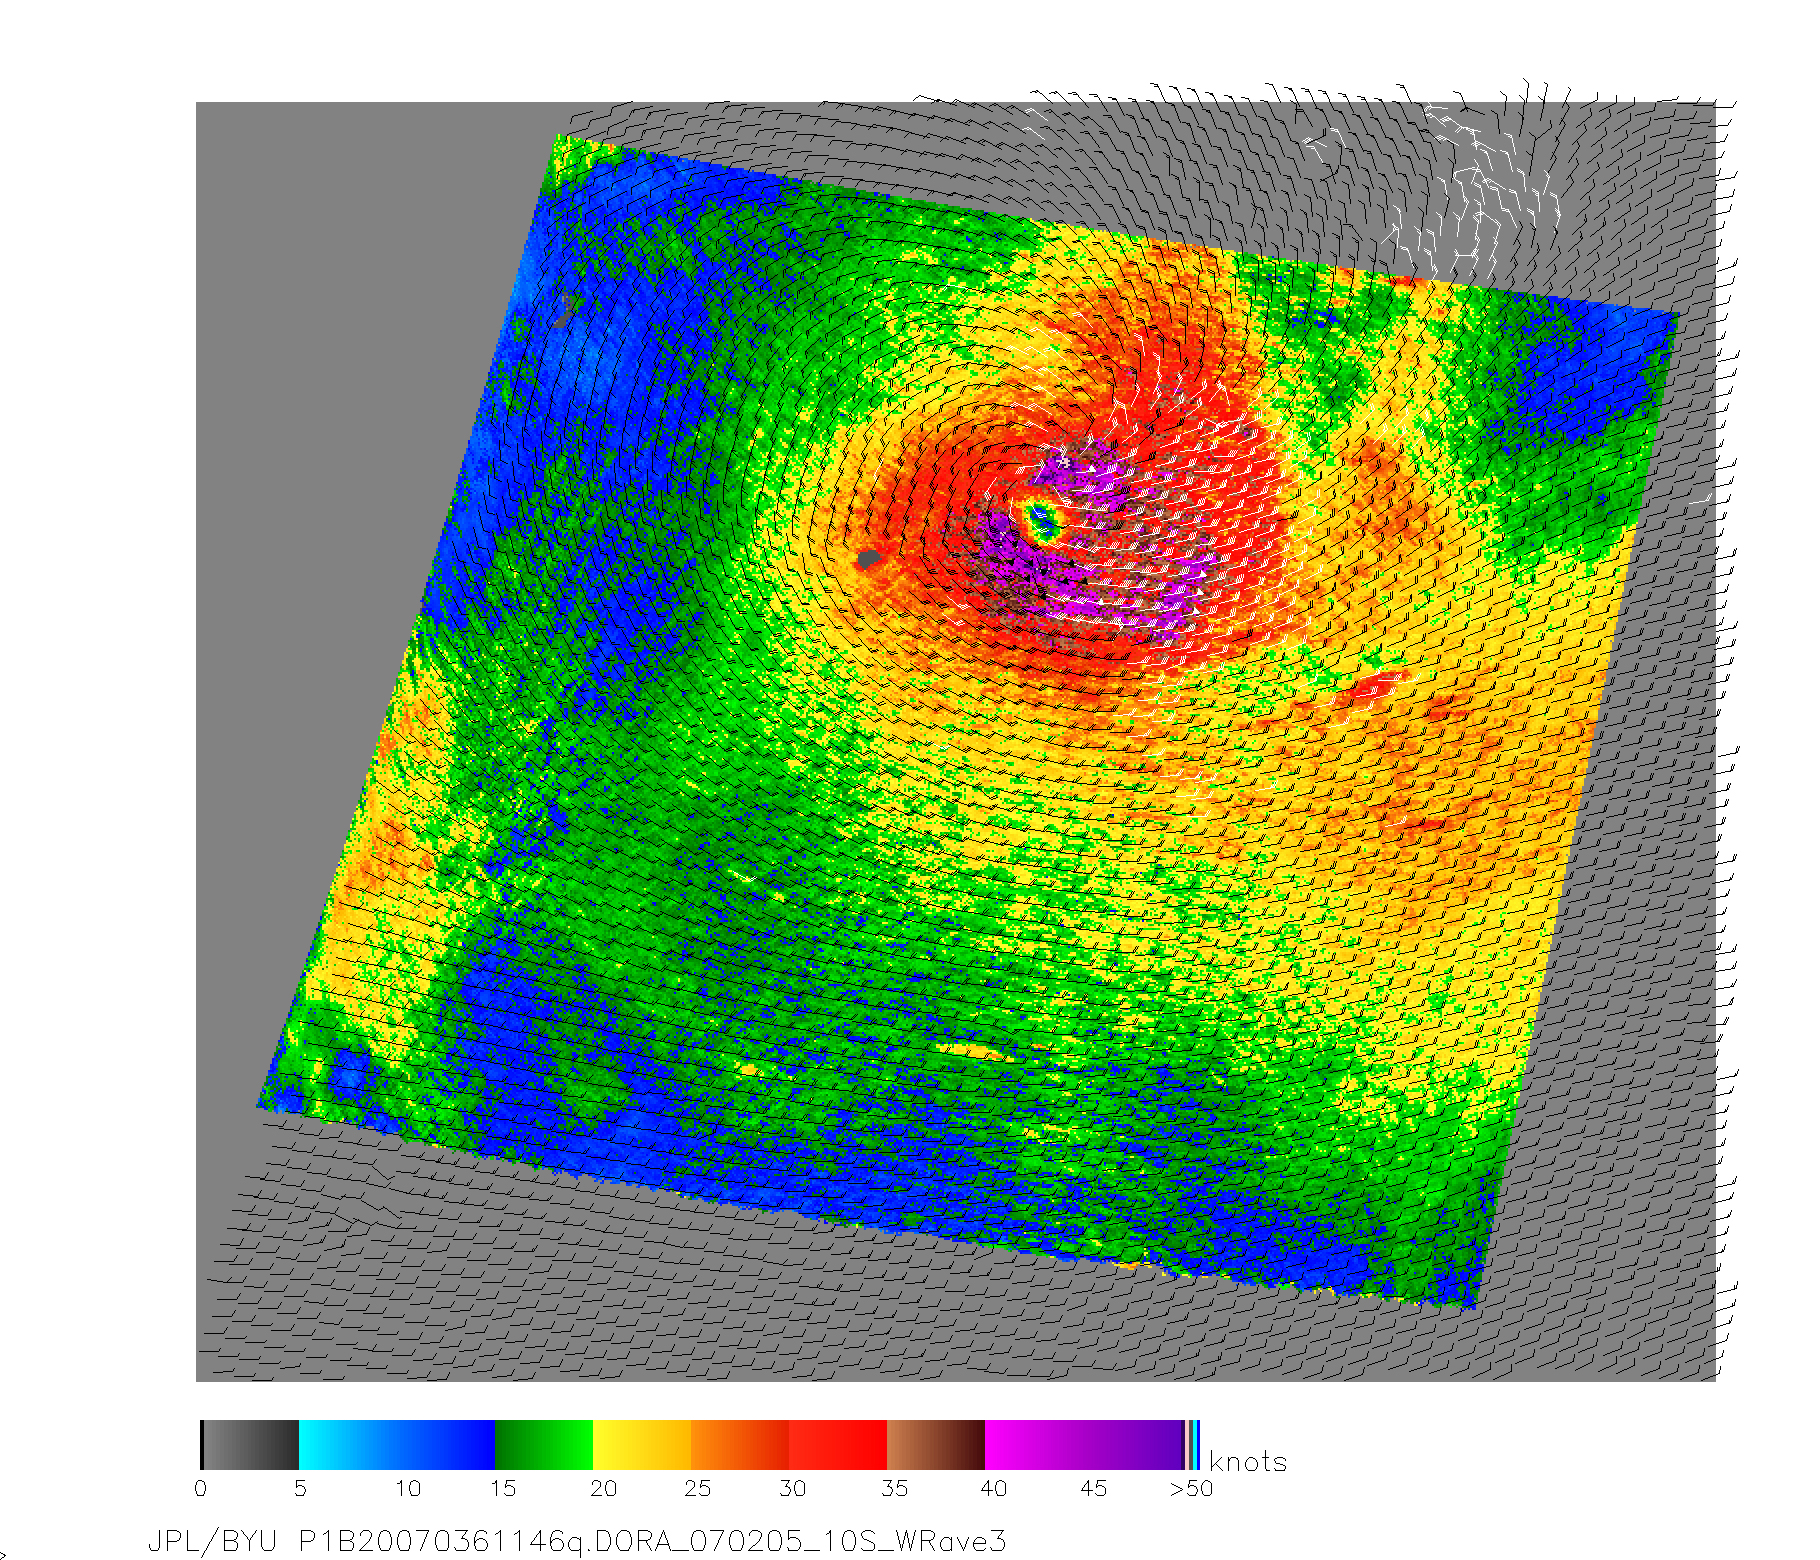
Powerful winds spiral in towards the calm center of Tropical Cyclone Dora in this image made from data captured on February 5, 2007, by the SeaWinds Scatterometer on NASA’s QuikSCAT satellite. The satellite records wind speed and direction at an altitude of 10 meters above the ocean’s surface. Wind speed is represented by color in this image, with the strongest winds in purple, and the calmest areas in blue. The barbs indicate both wind direction and rainfall. Areas of heavy rain are marked with white barbs. Not surprisingly, the strongest winds and heaviest rain surround the eye of the storm, which is an island of blue, indicating light winds, surrounded by the reds and purples of powerful winds.
At the time this image was taken (13:20 UTC), Dora was dissipating from a Category 4 cyclone, reported the University of Hawaii’s Tropical Storm Information Center. The storm formed on January 28 over the central Indian Ocean. As it moved south, the storm intensified until its winds peaked at 213 kilometers per hour (132 mph, 115 knots), making it the equivalent of a weak Category 4 hurricane. By February 5, when QuikSCAT observed the storm, it had winds of 120 kilometers per hour (75 mph, or 65 knots) with gusts to 148 kilometers per hour (92 mph, 80 knots). As of February 6, the storm was expected to disintegrate as it moved south over cooler waters. Dora was not forecast to threaten land, though this image shows the outer edges of the storm over Rodrigues Island.
NASA image courtesy of David Long, Brigham Young University, on the QuikSCAT Science Team, and the Jet Propulsion Laboratory.
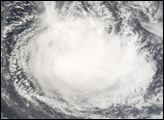
Tropical Cyclone Dora spun south over the Indian Ocean as it built and dissipated in early February 2007.
alert message