

Summer officially came to an end in Australia on March 20, 2006. For northeastern Australia (Queensland and New South Wales), it was the hottest summer on record, according to the Australian Bureau of Meteorology, and that was bad news for Australia’s Great Barrier Reef. Up to 50 percent of coral bleached at certain inshore locations in the southern Great Barrier Reef. In general, hot water puts coral under stress. Under such conditions, the coral expels the tiny algae, zooxanthellae, that live in symbiosis with it. The algae give the coral its color and produce nutrients through photosynthesis, so when the algae are expelled, the coral turns white and eventually dies. The process is called coral bleaching.
But coral bleaching is only one symptom of an ecosystem in hot water: high temperatures have a negative impact on other parts of the marine ecosystem as well. “All marine species operate within a range of environmental parameters. Once this changes, the effects cascade through the food-chain,” says Scarla Weeks, an ocean researcher at the University of Queensland, Australia, funded by the Pew Institute for Ocean Science. Ocean currents are driven in part by water temperature, and if a current shifts, this may impact an entire ecosystem. Warmer temperatures may result in decreased concentrations of phytoplankton, the tiny plants that grow in the upper sun-lit layer of the ocean. Because phytoplankton form the base of the marine food chain, their decline will cascade through the food chain. Larger animals like fish will have little to eat and either die or move elsewhere. Loss of fish impacts the sea birds that feed on them. In 2002, says Weeks, high sea surface temperatures led to the worst bleaching event on record in the Great Barrier Reef. The same year, 50 percent of seabird chicks on Heron Island in the southern Great Barrier Reef starved because the adult birds were unable to find enough fish.
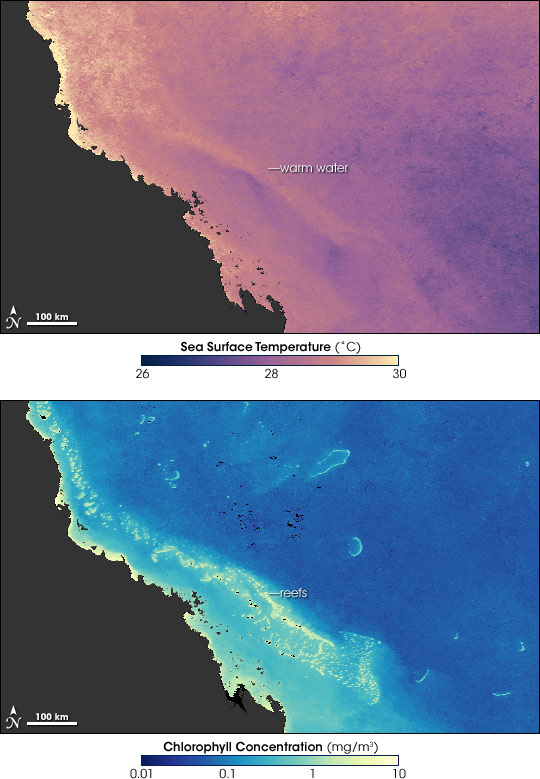
The chain from warm water to coral bleaching and sea bird deaths is long and complex, but satellite data may provide some insight into the mechanisms controlling the chain. Weeks is using NASA sea surface temperature and chlorophyll concentration data to study these complex ocean processes. The images above illustrate sea surface temperatures and chlorophyll concentrations as observed by the Moderate Resolution Imaging Spectroradiometer (MODIS) on NASA’s Aqua satellite between February 6 and February 20, 2006. Warm pink and yellow tones show where sea surface temperatures were warm in the top image. The warmest waters are the shallow waters over the reef near the coast, where coral bleaching was most severe this summer.
The lower image shows chlorophyll concentrations, where high concentrations (yellow) generally point to a high concentration of phytoplankton in surface waters of the ocean. In this image, the bright yellow dots actually represent the coral reefs, and not surface phytoplankton. Ocean waters are clear off Australia’s northeast coast. The patterns shown here reveal the movement of ocean currents, with lower chlorophyll concentrations representing oceanic waters. By studying the changing patterns, scientists can monitor the dynamics of the Great Barrier Reef and every link in that marine ecosystem.
For more information, read: NASA Helps Researchers Diagnose Recent Coral Bleaching at Great Barrier Reef
Images by Norman Kuring and Robert Simmon, based on data provided by Scarla Weeks, University of Queensland