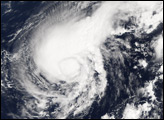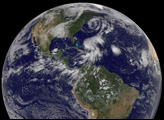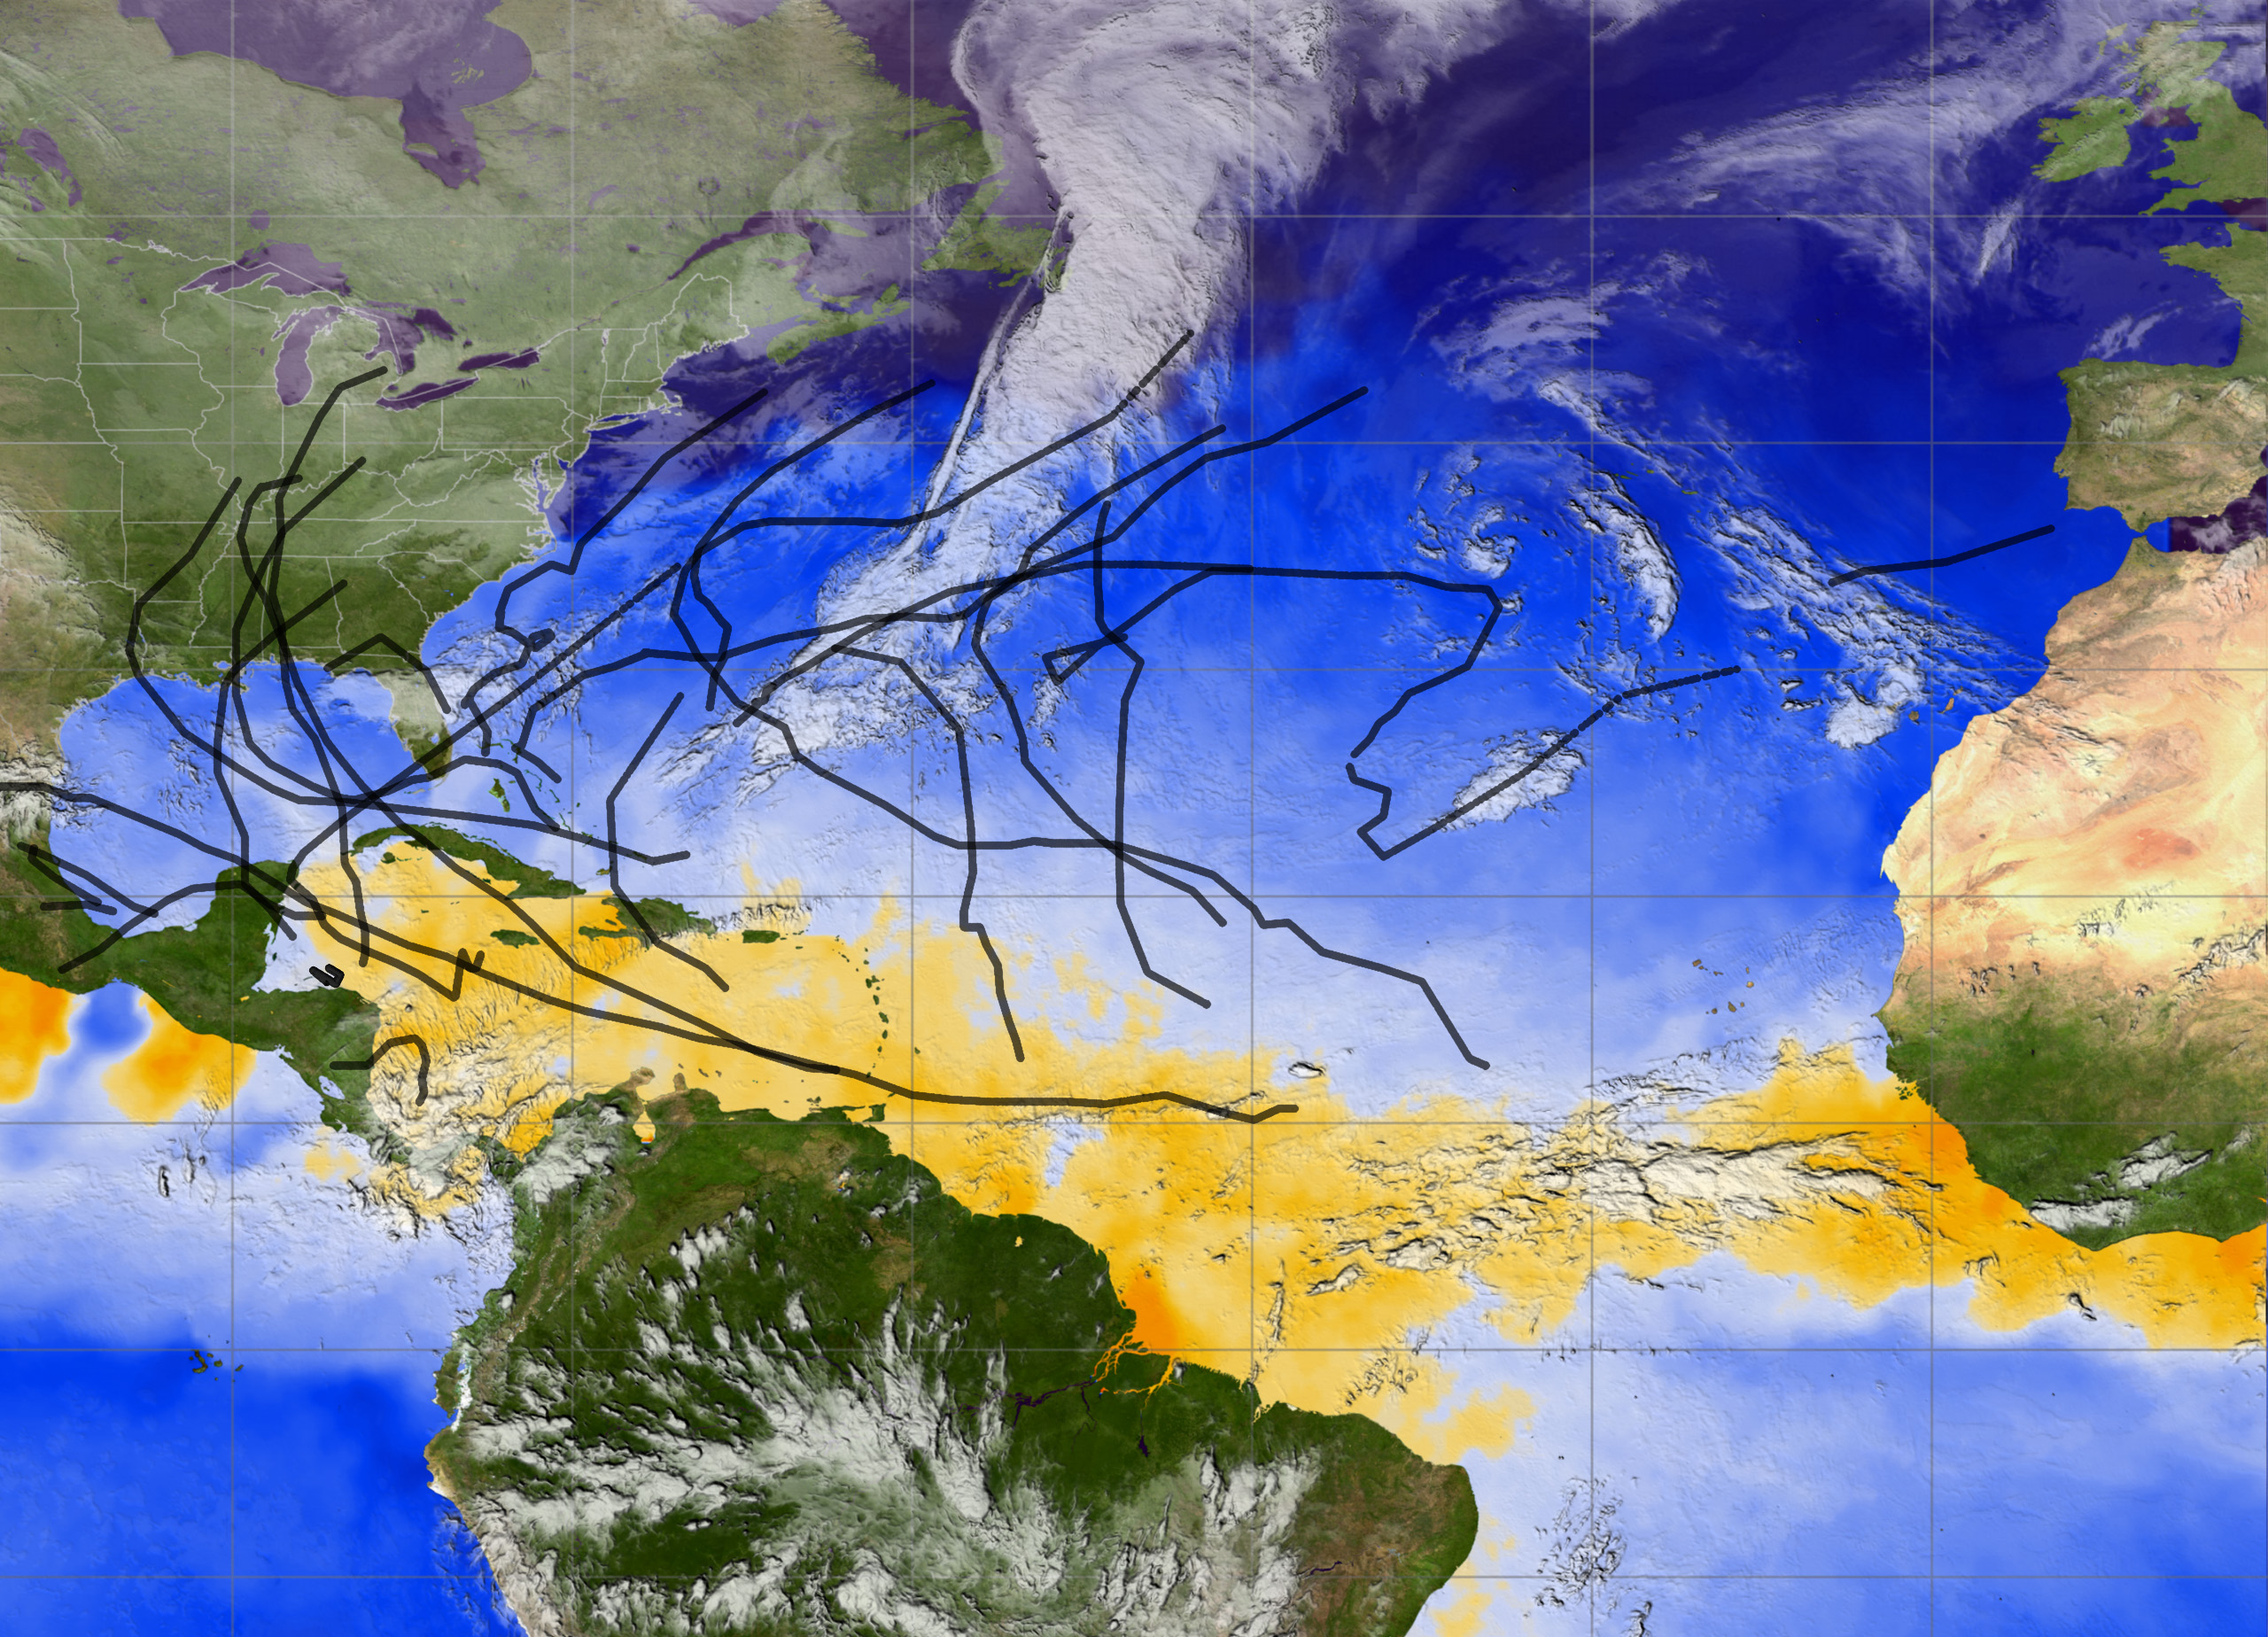

The 2005 Atlantic Hurricane season broke record after record—most named storms, lowest pressure measured in the Atlantic, longest-lived December hurricane—and the list goes on. This image provides a summary of the season, with the track of each named storm marked in black. In all, 30 tropical depressions, tropical storms, and hurricanes formed in 2005 (see table at the end of the article). Of these, 26 were named storms, a status given to tropical storms and hurricanes.
In this image, the storm tracks are laid on top of sea surface temperature measurements collected by the AMSR-E instrument on NASA’s Aqua satellite on December 12, 2005, four days after Hurricane Epsilon dissipated. Though temperatures have cooled considerably compared to earlier in the season, a band of warm water, shown in orange, still stretches across the Atlantic from Africa to the Yucatan. Warm ocean waters provide fuel to developing storms, and it is the cooling of the ocean that ends the hurricane season. In order for a tropical cyclone to develop, sea surface temperatures need to be above 28 degrees Celsius (82 Fahrenheit), a threshold that is shown in orange in this image. Water in the Gulf of Mexico, where high temperatures fueled the season’s monster storms Katrina, Rita, and Wilma, has now cooled.
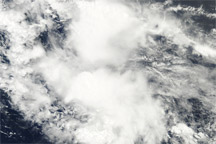
The relationship between sea surface temperature and storm development can be seen in the animation, which shows clouds from the GOES-12 satellite over sea surface temperatures for each day of the season, from June 1 to November 1, 2005. The action starts in mid-June with Arlene forming off the coast of Honduras and heading northward through the Gulf of Mexico. A month later, powerful Emily blazes a long trail from the Atlantic, through the Caribbean Sea, and into the Gulf. From late July to mid-August, warm ocean temperatures spread farther north, while storms Franklin, Irene, and Harvey stay out in the Atlantic, far from land.
On August 24, Katrina appears southeast of Florida, strengthening as it follows a trail of very warm waters (red areas) through the Gulf, and leaving a path of cool temperatures (blue areas) in its wake. One month later, the eye of Rita sits over the Texas-Louisiana Gulf Coast, while its outermost band of clouds brushes the southern end of Lake Michigan. By October 23, the list of storm names was exhausted, with Wilma brushing the tip of the Yucatan Peninsula, and Alpha menacing the island of Hispaniola.
You can also download high-resolution versions of the storm track animation from the Science Visualization Studio.
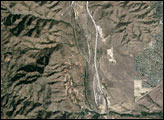
The storms are summarized chronologically in the following table. Storm information in the table is from UNISYS’ 2005 Hurricane/Tropical Data for the Atlantic. Images and captions for most of these storms are available in the Natural Hazards section of the Earth Observatory and can be viewed by clicking on the storm name. Because storms 10, 19, 22, and 27 were tropical depressions, they are not included in the image.
| # | Name | Date | Category |
|---|---|---|---|
| 1 | Tropical Storm Arlene | June 8–13 | |
| 2 | Tropical Storm Bret | June 28–30 | |
| 3 | Tropical Storm Cindy | July 3–7 | |
| 4 | Hurricane Dennis | July 5–3 | 4 |
| 5 | Hurricane Emily | July 11–21 | 4 |
| 6 | Tropical Storm Franklin | July 21–29 | |
| 7 | Tropical Storm Gert | July 23–25 | |
| 8 | Tropical Storm Harvey | August 2–8 | |
| 9 | Hurricane Irene | 04–18 August | 2 |
| 10 | Tropical Depression 10 | August 13–14 | |
| 11 | Tropical Storm Jose | August 22–23 | |
| 12 | Hurricane Katrina | August 23–31 | 5 |
| 13 | Tropical Storm Lee | August 28–September 2 | |
| 14 | Hurricane Maria | September 1–10 | 3 |
| 15 | Hurricane Nate | September 5–10 | 1 |
| 16 | Hurricane Ophelia | September 6–18 | 1 |
| 17 | Hurricane Philippe | September 17–24 | 1 |
| 18 | Hurricane Rita | September 18–26 | 5 |
| 19 | Tropical Depression 19 | September 30–October 2 | |
| 20 | Hurricane Stan | October 1–5 | 1 |
| 21 | Tropical Storm Tammy | October 5–6 | |
| 22 | Tropical Depression 22 | October 8–9 | |
| 23 | Hurricane Vince | October 9–11 | 1 |
| 24 | Hurricane Wilma | October 15–25 | 5 |
| 25 | Tropical Storm Alpha | October 22–24 | |
| 26 | Hurricane Beta | October 27–31 | 3 |
| 27 | Tropical Depression 27 | November 14–16 | |
| 28 | Tropical Storm Gamma | November 18–21 | |
| 29 | Tropical Storm Delta | November 23–28 | |
| 30 | Hurricane Epsilon | November 29–December 8 | 1 |
Image and animation courtesy NASA GSFC Scientific Visualization Studio
alert message