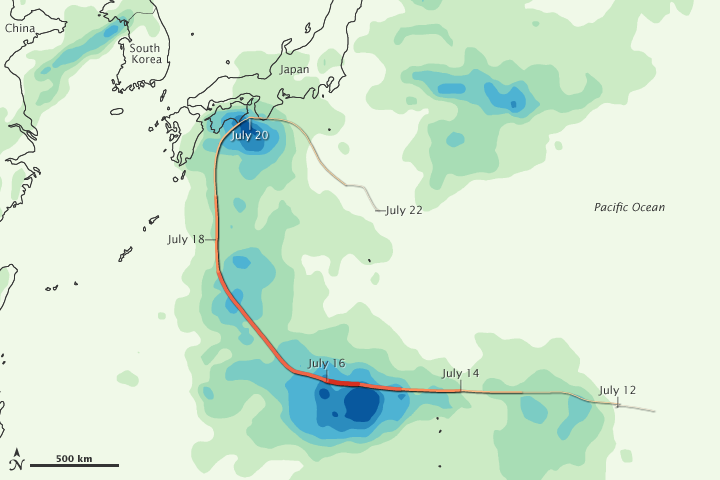


Ma-on formed over the western Pacific Ocean in early July, traveled west then north, and made a U-turn along the shore of Japan. En route to Japan, the storm strengthened into a Category 4 typhoon, and dropped heavy precipitation.
This color-coded image shows rainfall amounts from July 14 to 21, 2011. The lightest rainfall amounts (less than 50 millimeters or about 2 inches) appear in pale green. The heaviest amounts (more than 300 millimeters or about 12 inches) appear in dark blue. The heaviest rainfall occurs over the Pacific Ocean south of Japan, including an area immediately off the coast.
Superimposed on the rainfall amounts is a storm track for Ma-on. Darker shades of orange indicate greater storm strength. Dates on the storm track indicate Ma-on’s location as of midnight UTC on each date. Ma-on peaked late in the day on July 15, and weakened considerably on July 21.
Ma-on was downgraded to a tropical storm before it reached Japan, but the storm still brought heavy rains and strong winds to the country. On July 21, The Japan Times reported that Ma-on disrupted air and rail transportation. Meanwhile, officials blamed the storm for more than 50 injuries and at least one death. Authorities warned residents to remain alert for floods and landslides as Ma-on moved off.
This image is based on data from the Multisatellite Precipitation Analysis produced at Goddard Space Flight Center, which estimates rainfall by combining measurements from many satellites and calibrating them using rainfall measurements from the Tropical Rainfall Measuring Mission (TRMM) satellite.
NASA Earth Observatory image by Jesse Allen, using near-real-time data provided courtesy of TRMM Science Data and Information System at Goddard Space Flight Center. Caption by Michon Scott.