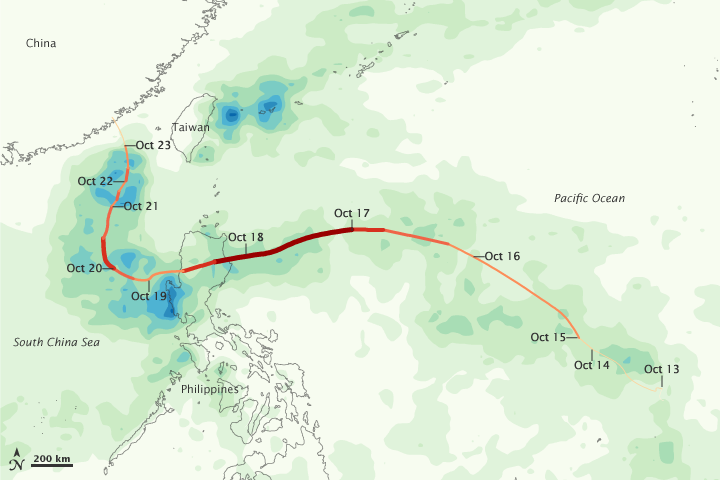


Though a storm’s strength is gauged by wind speed, tropical cyclones also pose a hazard because of the intense rain they bring to a region. This image shows the heavy rain Super-typhoon Megi unleashed as it tracked west across the Pacific between October 13 and October 23, 2010. The heaviest rainfall—more than 600 millimeters or nearly 24 inches—appears in dark blue. The lightest rainfall—less than 75 millimeters or 3 inches—appears in light green.
The storm’s track is superimposed on the rainfall map. Megi formed as a tropical depression over the western Pacific Ocean on October 13, 2010. It quickly strengthened to a named storm, and three days after forming, had grown to a super typhoon. In general, rainfall roughly matches the storm track, especially west and northwest of the Philippines.
Over the northern Philippines, Megi cut a wide swath of destruction, destroying homes and accounting for at least 28 deaths, according to the Associated Press. As the storm track indicates, Megi reached its greatest intensity immediately east of the Philippines. The storm weakened slightly after October 17, but remained powerful across the northern Philippines.
Over the South China Sea, Megi re-strengthened somewhat before making landfall along the Chinese coast. The storm dropped heavy precipitation along a curving path between the Philippines and China.
Away from the storm track, areas of heavy rainfall appear east of Taiwan, where torrential rains led to deadly landslides. The Associated Press reported that, as of October 24, floods and landslides had killed as many as 31 people in that island nation. United Daily News reported that the heavy rains in Taiwan might have resulted from interactions between Megi and monsoon weather patterns northeast of the storm.
This image is based on data from the Multisatellite Precipitation Analysis produced at NASA's Goddard Space Flight Center, which estimates rainfall by combining measurements from many satellites and calibrating them using rainfall measurements from the Tropical Rainfall Measuring Mission (TRMM) satellite.
NASA Earth Observatory image by Jesse Allen, using near-real-time data provided courtesy of TRMM Science Data and Information System at Goddard Space Flight Center. Caption by Michon Scott.