

Over the span of 11 years, the Sun’s activity waxes and wanes as magnetic field lines that are wound and tangled inside the Sun periodically break through to the surface. Solar cycle 23 peaked between 2000-2002, and Solar Cycle 24 began in early 2008. It’s normal for the old and new sunspot cycles to overlap for a time before the old one completely fades away, but Solar Cycle 24 has been very slow to ramp up.
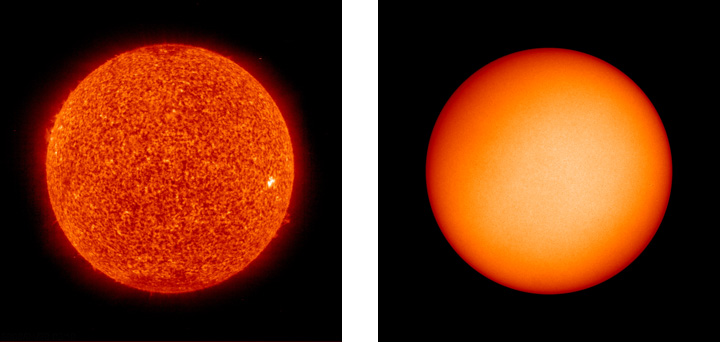
This pair of images from the Solar and Heliospheric Observatory (SOHO) spacecraft shows sunspots (right) and ultraviolet light (left) emitted by the Sun on April 29, 2009. The Sun continued its unusually quiet behavior, with only two small sunspots visible at far right (see large image).
If you map the location of the spots on the Sun’s surface over the course of a solar cycle, the pattern they make is shaped like a butterfly. The reason for the butterfly pattern is that the first sunspots of each new solar cycle occur mostly at the Sun’s mid-latitudes, but as the solar cycle progresses, the area of maximum sunspot production shifts toward the (solar) equator. The location of the April 29 sunspots near the solar equator is one sign that they belong to the previous cycle, however, and not the new one.
Astronomers have been tracking sunspot cycles for centuries, and climate scientists have documented a connection between climate and solar variability. The total amount of solar radiation reaching Earth varies by a small amount (roughly 0.1 percent) between solar maximum and solar minimum, causing slight warming and cooling in global average climate. The Solar Activity collection in our new World of Change series shows sunspot activity every April 29 since 1999.
Sunspot images from MDI Data Services and Information. Ultraviolet images from SOHO Project Website.