full size images:
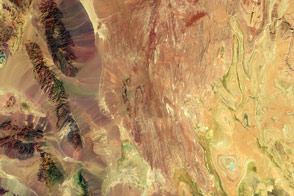
true color (340 KB)
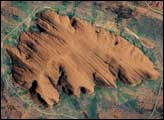
Minerals Derived from Vibrational Absorption (with key, 300 KB)
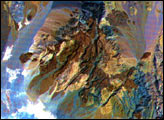
Minerals Derived from Electronic Absorption (with key, 250 KB)
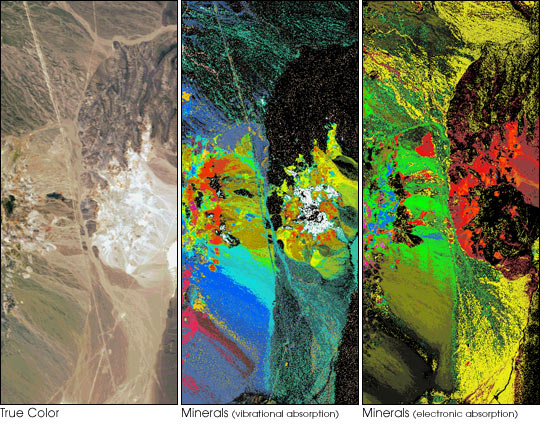
Goldfield, Nevada was the site of one of the Twentieth Century’s richest gold strikes. The prospector Jim Butler initially discovered gold ore in 1900, production in the region’s mines peaked in 1906, and by 1910 Goldfield was already on the way to becoming a ghost town.
In those days, prospectors used a burro and a rock hammer to explore for minerals. Today high flying sensors aboard aircraft and satellites do the dirty work. The above images of Cuprite, Nevada (just southeast of Goldfield) were taken by the Airborne Visible and Infrared Imaging Spectrometer (AVIRIS). AVIRIS collects data in 224 spectral bands, ranging from visible blue (0.4 µm) to shortwave infrared (2.5 µm). The large number of closely spaced bands allows geologists to calculate spectra for each pixel of the image, and determine what minerals are on the surface (assuming there’s no vegetation in the way).
The image on the left is true color, showing how the scene would look to our eyes. The exposed rock is fairly uniform in color, with little to distinguish specific types of minerals. The central image uses spectra from 2.0 to 2.5 µm, which are sensitive to absorption caused by molecular vibration. (Full size image with key) The image shows Hydroxide (OH), Carbonate (CO3), and Sulfate (S04) bearing minerals. The red, orange, and mustard colored pixels in the center of the image represent different types of alunite, , a sulfate mineral often associated with gold deposits. On the right is a map of minerals derived from electronic absorption features in the 0.4 to 1.2 µm spectral region. (Full size image with key) This technique detects Ferrous (Fe 2+) and Ferric (Fe 3+) minerals—different types of iron-rich rock. Red and orange areas to the right of center in this image indicate the presence of hematite (an iron oxide) with different grain sizes.
For more information, visit the USGS Spectroscopy Lab and the Find the Minerals Game.
Image courtesy United States Geological Survey Spectroscopy Lab

