About a month after igniting on July 24, 2024, the Park fire charred nearly 670 square miles (170,000 hectares) of land in Northern California, according to a situation report from the National Interagency Fire Center. As of late August, the fire ranked as the state’s fourth-largest fire on record and its largest fire so far in 2024.
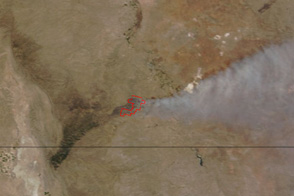
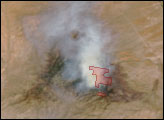
As the long-duration event unfolded, instruments orbiting Earth collected a wealth of data. For example, optical images captured in July revealed the dramatic smoke plume and burned area after an early period of rapid growth. The visuals on this page rely on detections of the fire’s thermal infrared energy, providing yet more details about the event and its evolution.
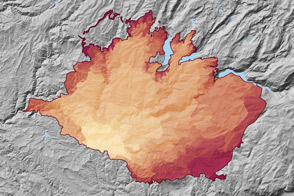
The animation above shows the fire’s progression between July 25 and August 10. Fire perimeter data are from the Fire Events Data Suite (FEDS), which tracks the growth and behavior of fires in the contiguous United States and Canada. FEDS ingests information every 12 hours from the VIIRS (Visible Infrared Imaging Radiometer Suite) sensors on the Suomi NPP and NOAA-20 satellites, which identify the hot spots of active fires during the day and night at a resolution of 375 meters per pixel.
The animation begins on July 25, a day after the fire’s ignition amid windy, hot, and dry conditions. Tempest McCabe, a scientist working at NASA’s Goddard Space Flight Center, pointed out two episodes of rapid spread visible in the animation. The first run occurred early on, starting on July 26, as the fire roared toward the northwest. The light brown gap visible on July 28 is part of the burned area, but the fire spread too fast through dry, grassy terrain for the FEDS algorithm to connect fire detections, given the 12-hour gap between satellite overpasses. A second run kicked off toward the northeast around August 6, and by August 10, FEDS data indicate that the fire had affected about 628 square miles (162,800 hectares).
“This is a large fire with long-term impacts,” said Douglas Morton of the Biospheric Sciences Laboratory at Goddard. “Our research team will want to look back at this one through the lens of fire behavior using the FEDS data—what drove the periods of rapid growth?”
To help them do that, the FEDS system simultaneously collects other information about a fire, such as its radiative power, which can be used to estimate a fire’s intensity. According to McCabe, this measurement peaked just before the Park fire’s two big spread events. The team also looks at meteorological information from ground-based weather stations and from NASA’s Global Modeling and Assimilation Office (GMAO). Collectively, such information can help scientists piece together a picture of how and why fires grow and change.
“Fires are burning in new and more extreme ways today,” Morton said. “With FEDS, we can dig into that to better understand the future of fires for science and management.”
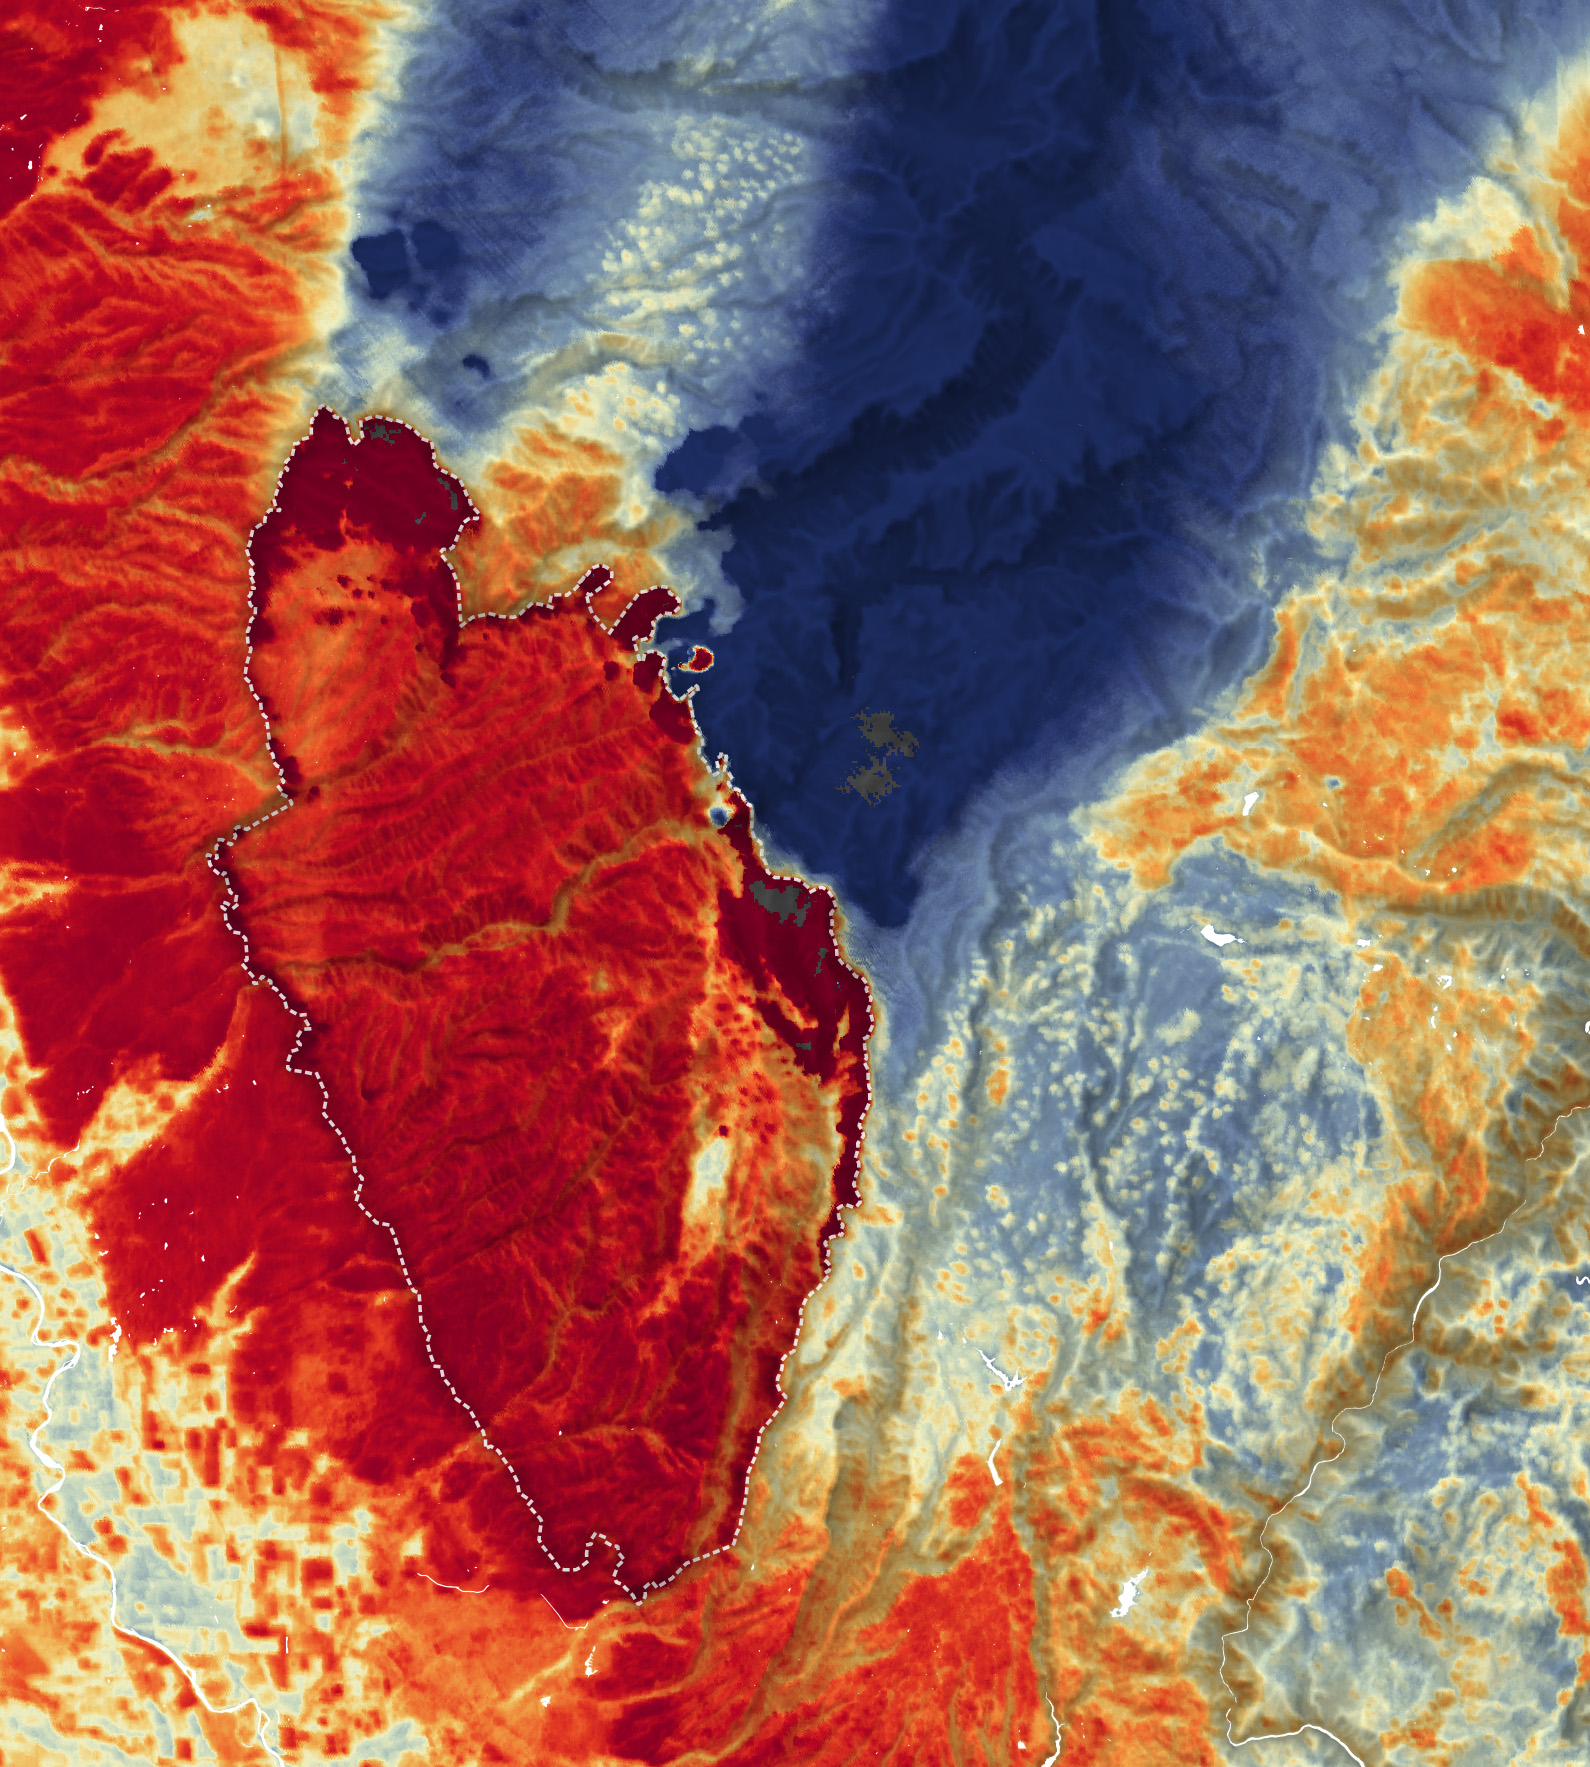
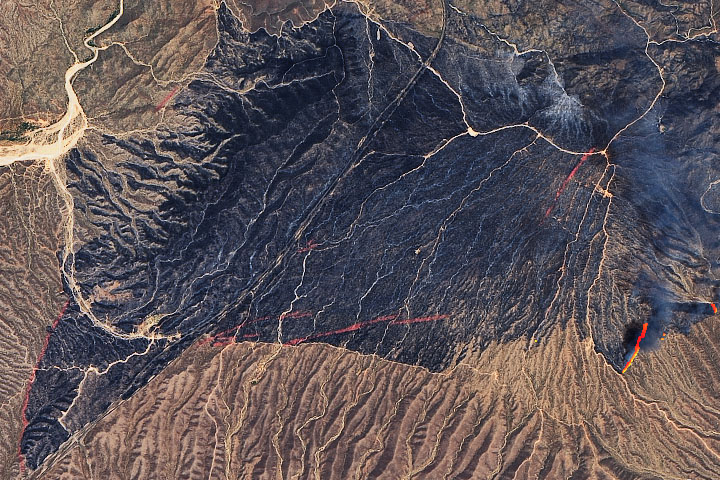
As the Park fire began its rapid push toward the northwest, NASA’s ECOSTRESS (Ecosystem Spaceborne Thermal Radiometer Experiment on Space Station) passed over the region and acquired this image (above) at 4:18 p.m. Pacific Daylight Time on July 26. ECOSTRESS uses a scanning radiometer to measure thermal infrared energy emitted from Earth’s surface and has a resolution of about 70 meters per pixel. Note that the sensor measures land surface temperatures, not air temperatures.
The highest temperature regions (dark red) along the fire’s perimeter are likely areas of active fire. Note that the scene was acquired after the FEDS map from the same day, and the fire perimeter (estimated) appears to have advanced.
As of August 26, Cal Fire reported no fire activity and that all the affected areas were in a phase of recovery. However, they also noted that warm and dry weather has made vegetation susceptible to ignition. As of that date, the Park fire had destroyed more than 700 structures.
NASA Earth Observatory animation by Michala Garrison, using FEDS data provided by Douglas Morton/GSFC. The FEDS algorithm was developed by Chen, Y. et al. (2022) at UC Irvine, GSFC, Cardiff U., and U. del Rosario. NASA Earth Observatory image by Wanmei Liang, using ECOSTRESS data from NASA AppEEARS. Basemaps use Landsat data from the U.S. Geological Survey and topographic data from the Shuttle Radar Topography Mission (SRTM). Story by Kathryn Hansen.
alert message