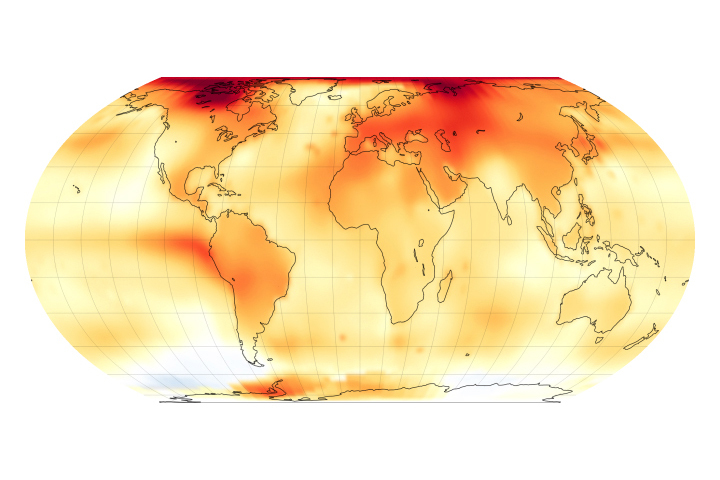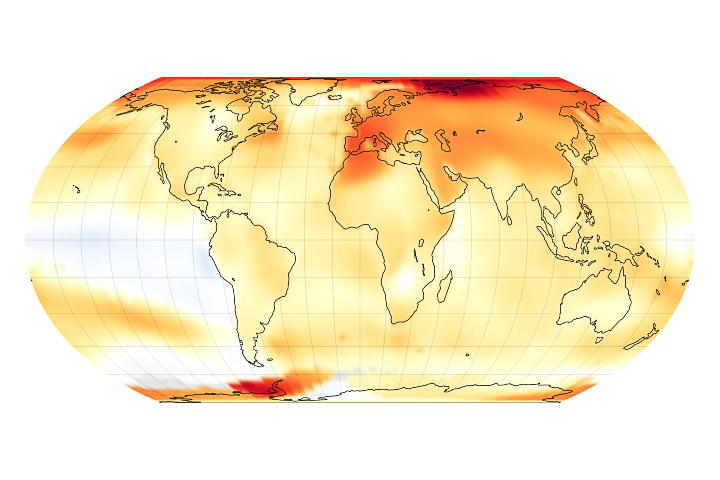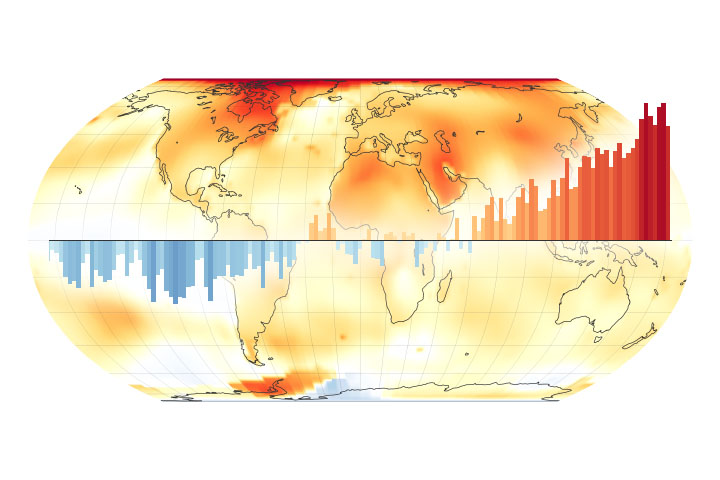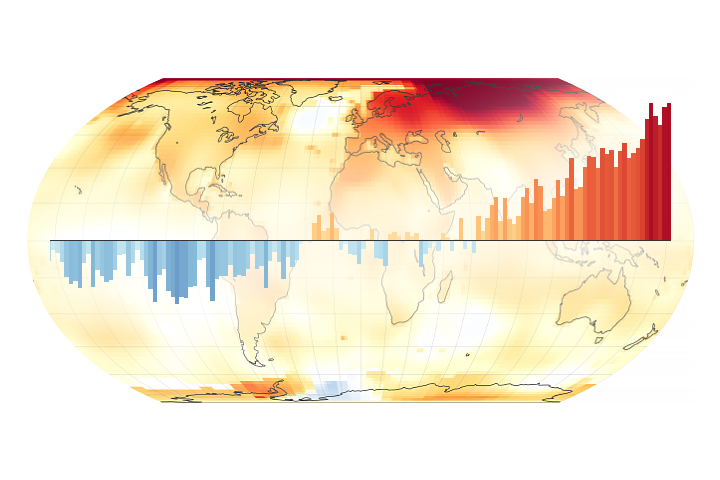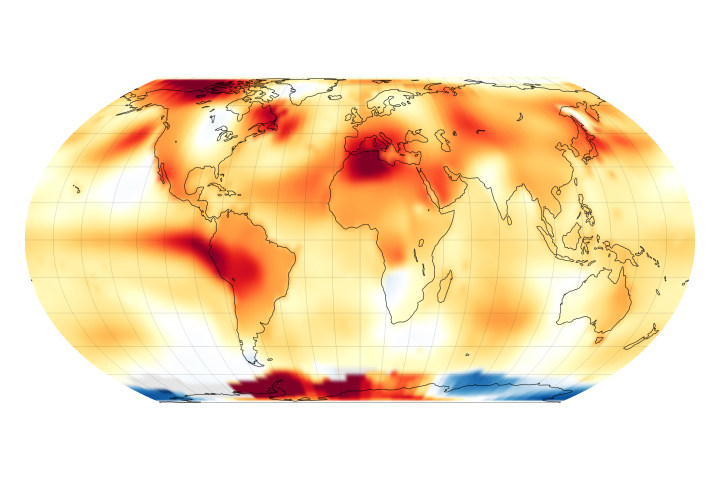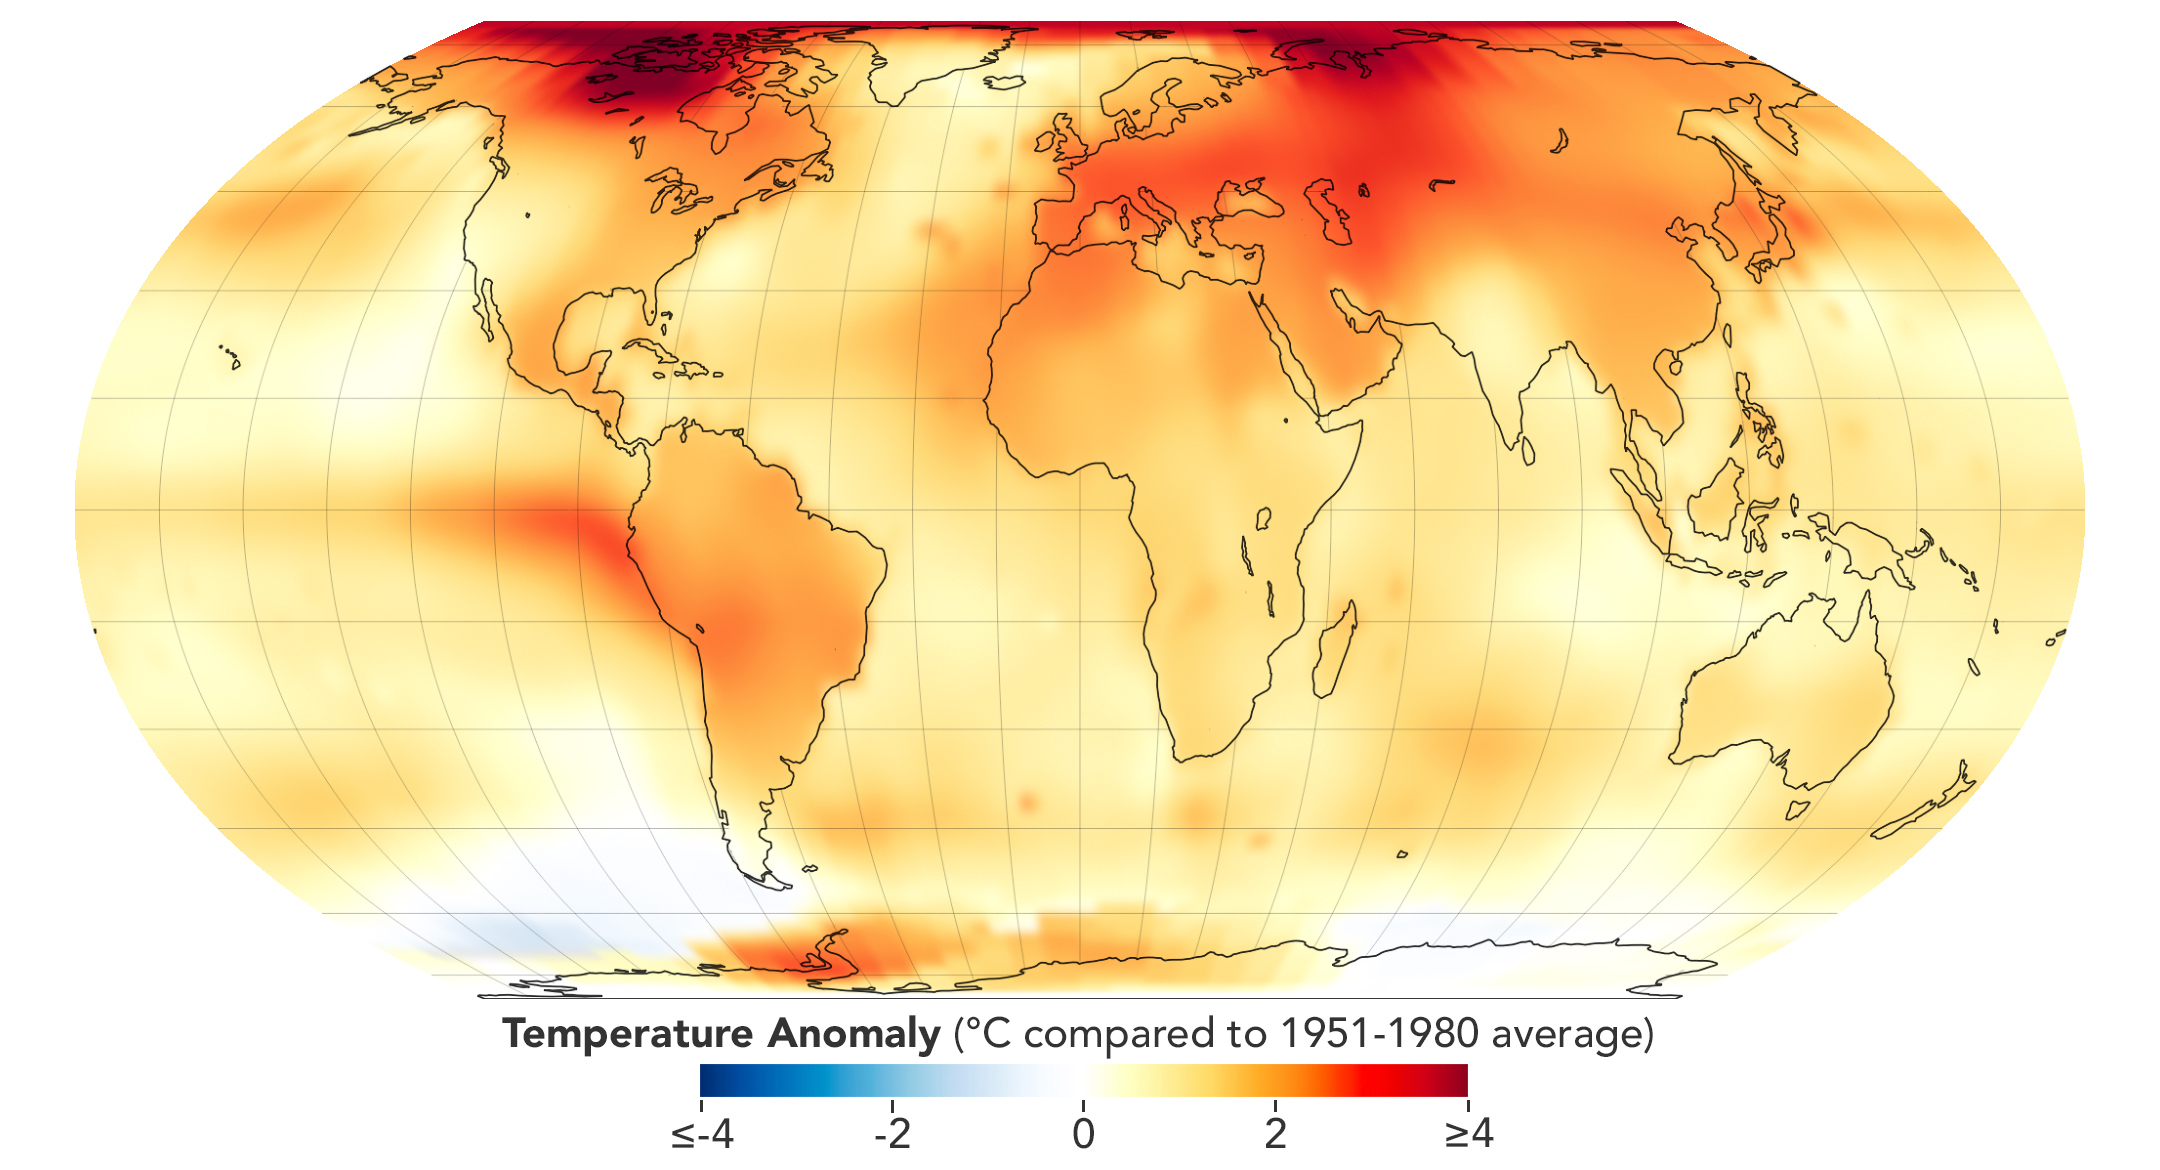
NASA announced that 2023 was the hottest year on record, according to an analysis of annual global average temperatures by the Goddard Institute for Space Studies. Scientists who maintain the temperature record, which begins in 1880, calculate a global temperature anomaly each year to determine how much temperatures have changed compared to temperatures from 1951–1980.
Every month from June through December 2023 came in as the hottest month on record. July ranked as the hottest month ever recorded.
But what caused 2023, especially the second half of it, to be so hot? Scientists asked themselves this same question. Here is a breakdown of primary factors that scientists considered to explain the record-breaking heat.
The long-term rise in greenhouse gases is the primary driver.
For more than 100 years, humans have been burning fossil fuels such as coal, gas, and oil to power everything from lightbulbs and cars to factories and cities. These actions, along with changes in land use, have led to a rise in greenhouse gases in the atmosphere. Greenhouse gases act like a blanket trapping heat around the planet. The more of them you add, the thicker that blanket becomes, further heating Earth.
In May 2023, carbon dioxide concentrations in the atmosphere peaked at 424 parts per million at NOAA’s Mauna Loa Observatory, Hawaii. The annual peak has been steadily rising since measurements began in 1958. (Other global carbon measurement projects showed similarly high numbers.) Extending the record back even further with ice cores, carbon dioxide concentrations are the highest they have been in at least 800,000 years.
“We’re going to continue to have records be broken because the baseline temperature is moving up all the time,” said Gavin Schmidt, director of NASA’s Goddard Institute for Space Studies in New York City. “The cause of that warming trend over the last 50 to 60 years is dominated by our changes to greenhouse gases, particularly carbon dioxide and methane.”
The return of El Niño added to the heat.
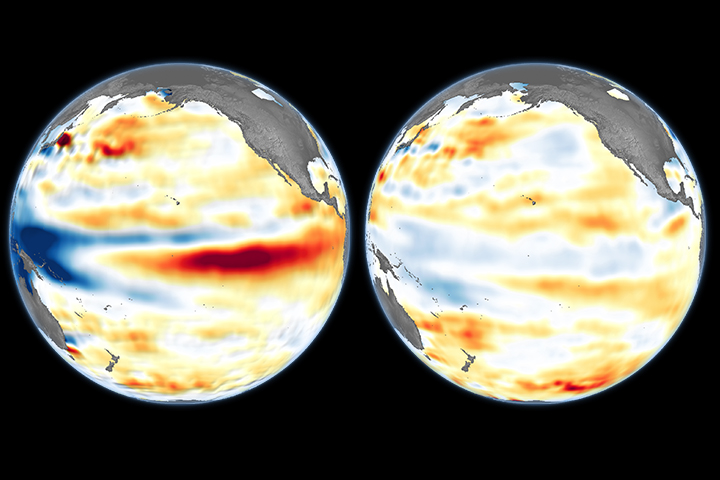
On top of the long-term global warming trend are natural variations in the climate. One of the largest sources of such year-to-year variability is the El Niño Southern Oscillation (ENSO), which occurs in the tropical Pacific.
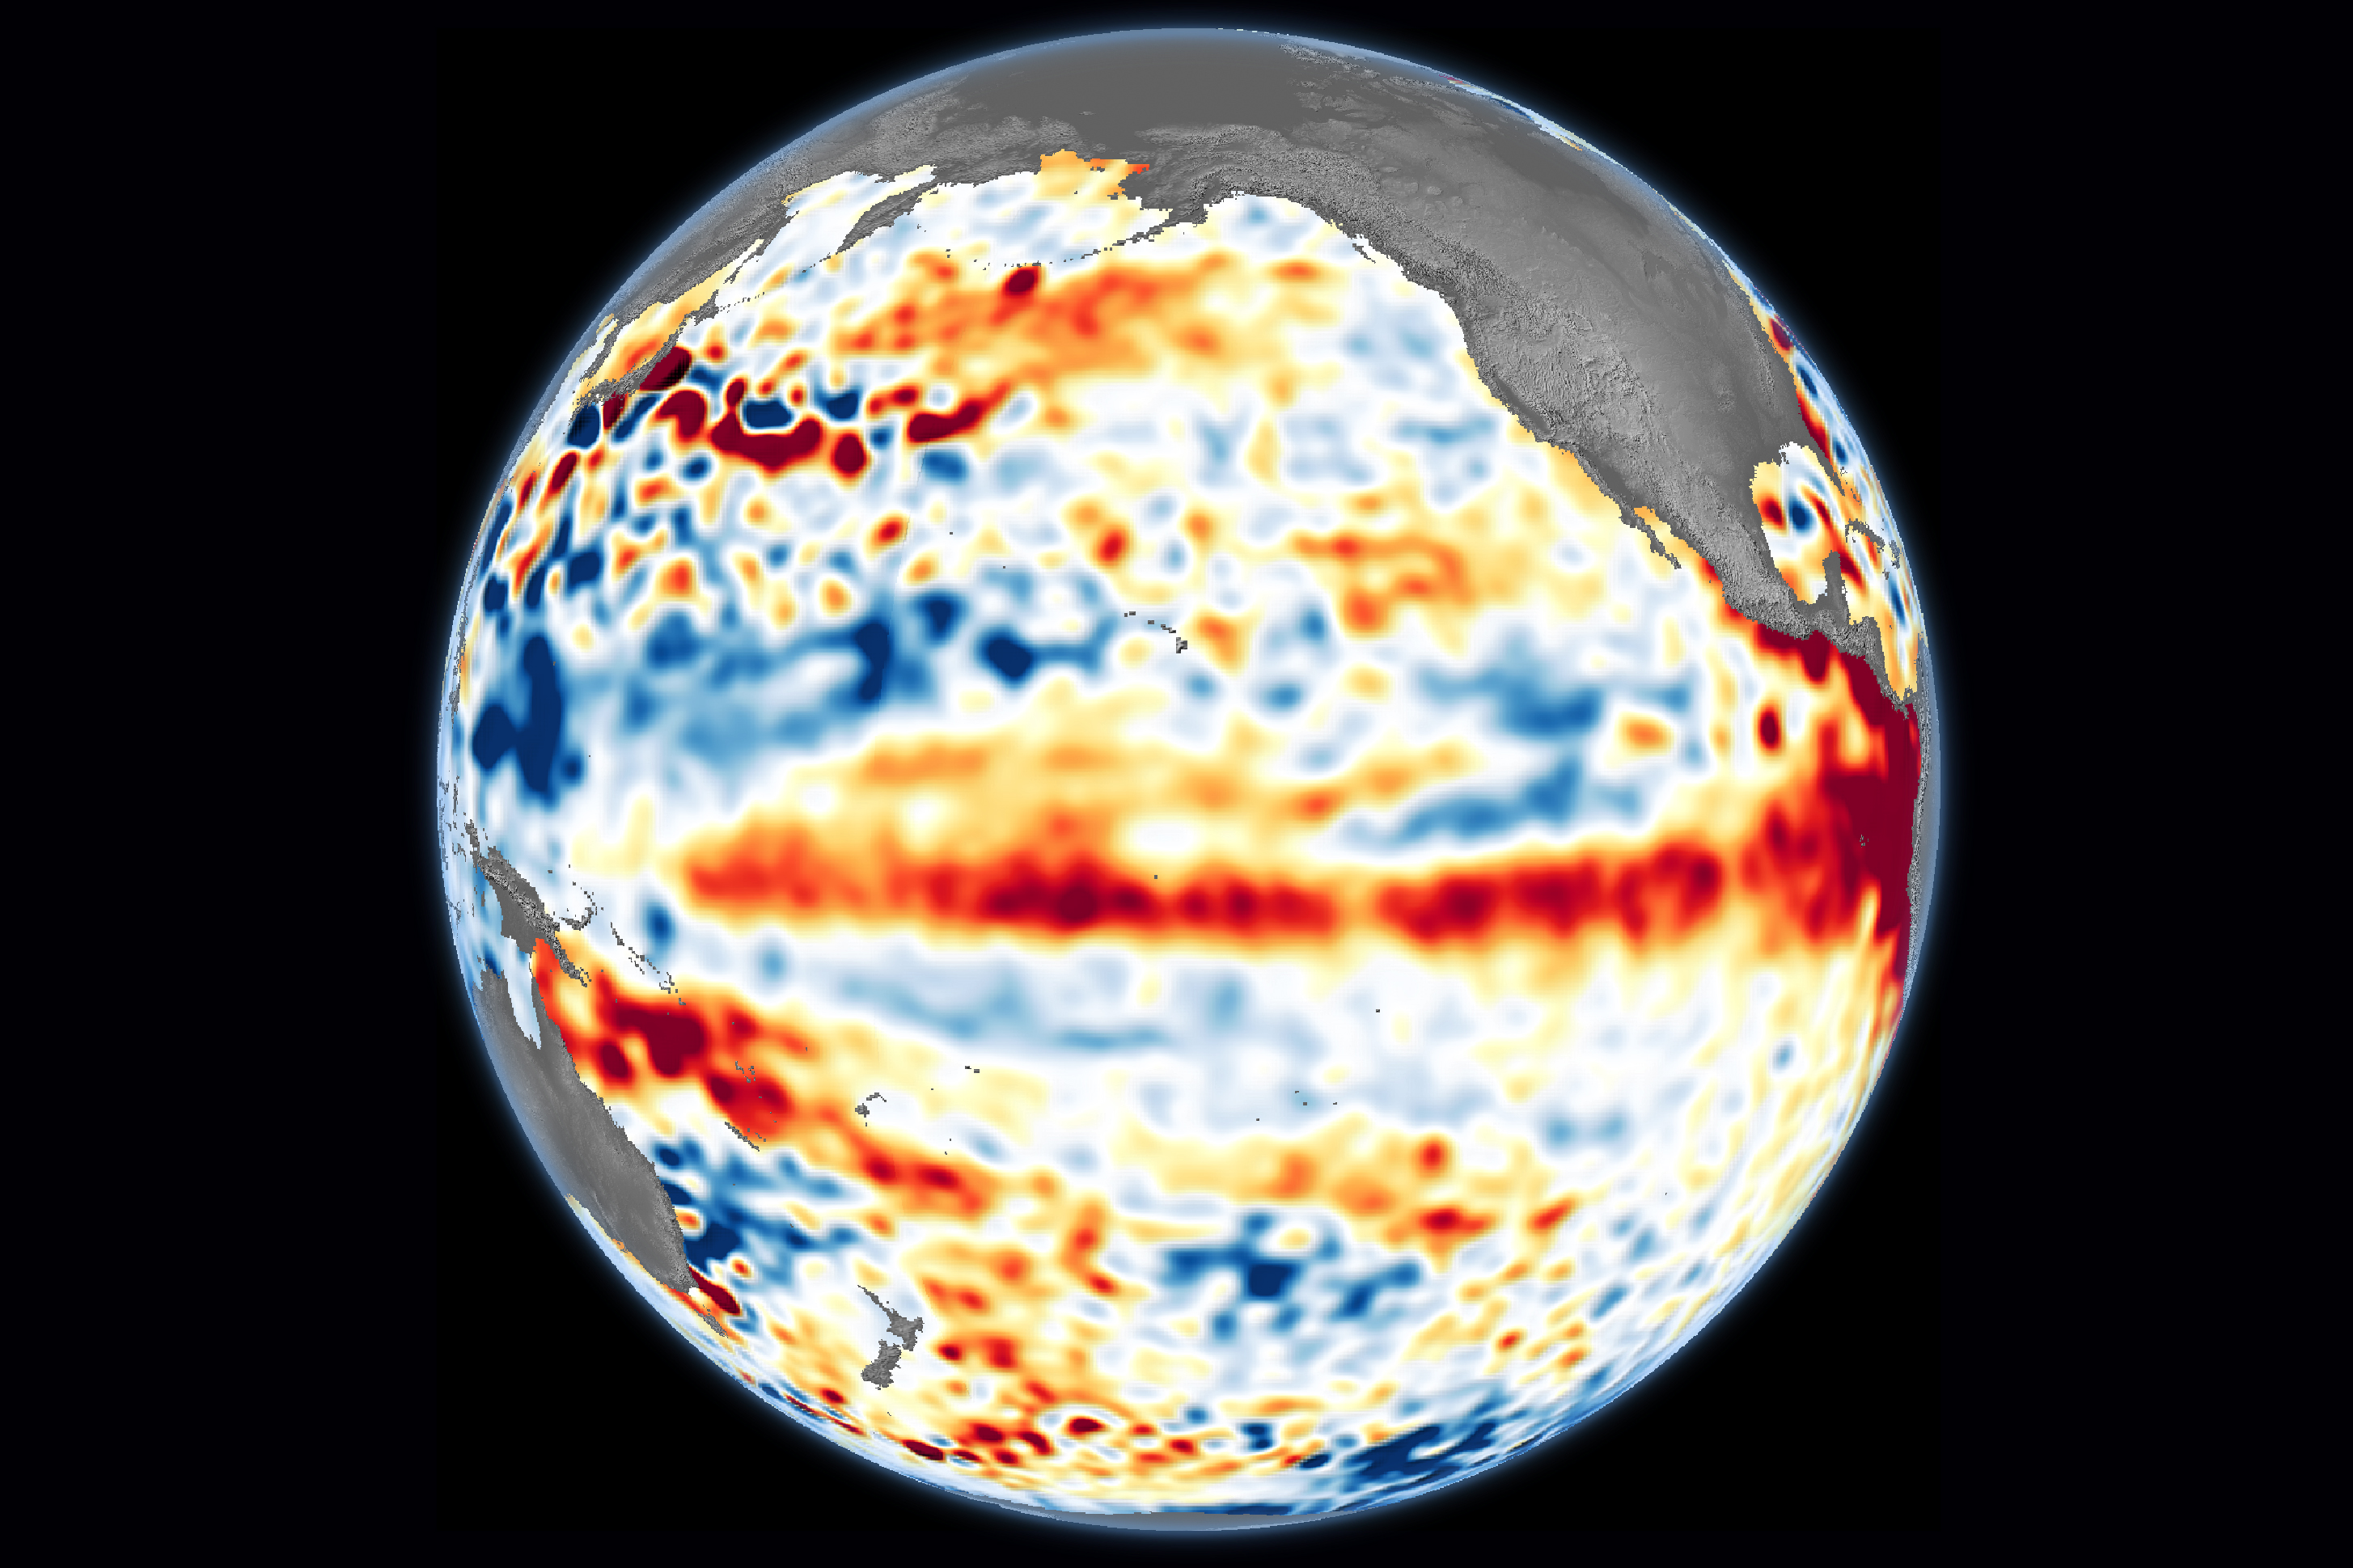
ENSO transitions between three phases: El Niño, La Niña, and neutral, or average. During El Niño, trade winds weaken; that is, winds that normally blow from east to west in the tropical Pacific weaken. The sea surface around the equator in the central and eastern Pacific near South America also becomes warmer (and higher) than normal. El Niño often coincides with the warmest years in the global average.
During La Niña, the opposite happens: the trade winds strengthen and the sea surface temperatures in the eastern Pacific are cooler than normal. This can help offset some of the rising temperatures from long-term global warming.
From 2020–2022, the Pacific saw three years of La Niña conditions. Then El Niño returned beginning in May 2023. This El Niño has not yet been as strong as those in 2015–2016 or 1997–1998, both of which caused large global average temperature spikes. However, when you add this ocean warming to the long-term warming trend from greenhouse gases, the start of El Niño helped temperatures jump enough to create a new record for heat.
“For the most part, it’s us and El Niño,” said Josh Willis, a climate scientist at NASA’s Jet Propulsion Laboratory. “At the end of the day, humans are heating the planet, and El Niño is dancing on our heads.”
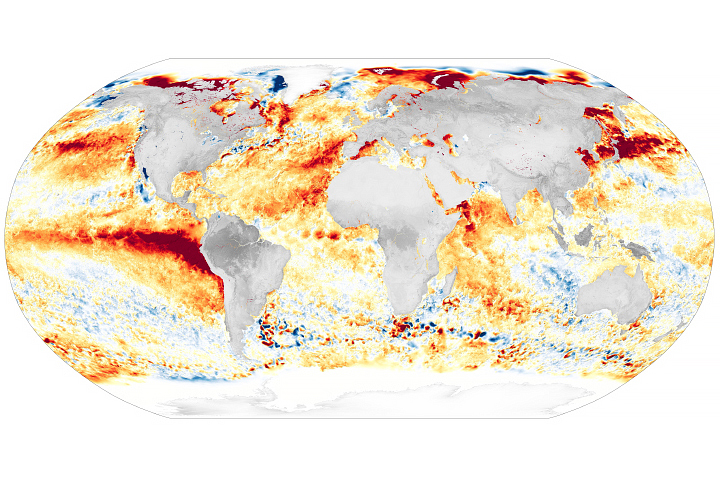
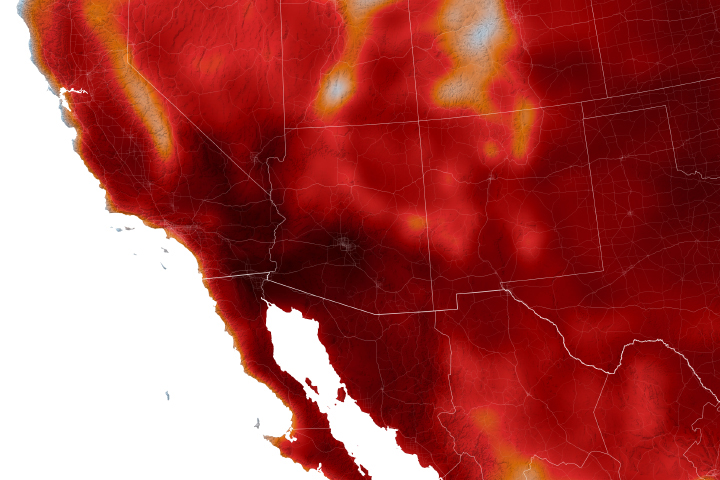
Globally, long-term ocean warming and hotter-than-normal sea surface temperatures played a part.
Looking more broadly, the tropical Pacific wasn’t the only part of the ocean that was hotter than normal this year. The global sea surface temperature set new records in 2023, with the North Atlantic and other parts of the ocean experiencing several marine heat waves.
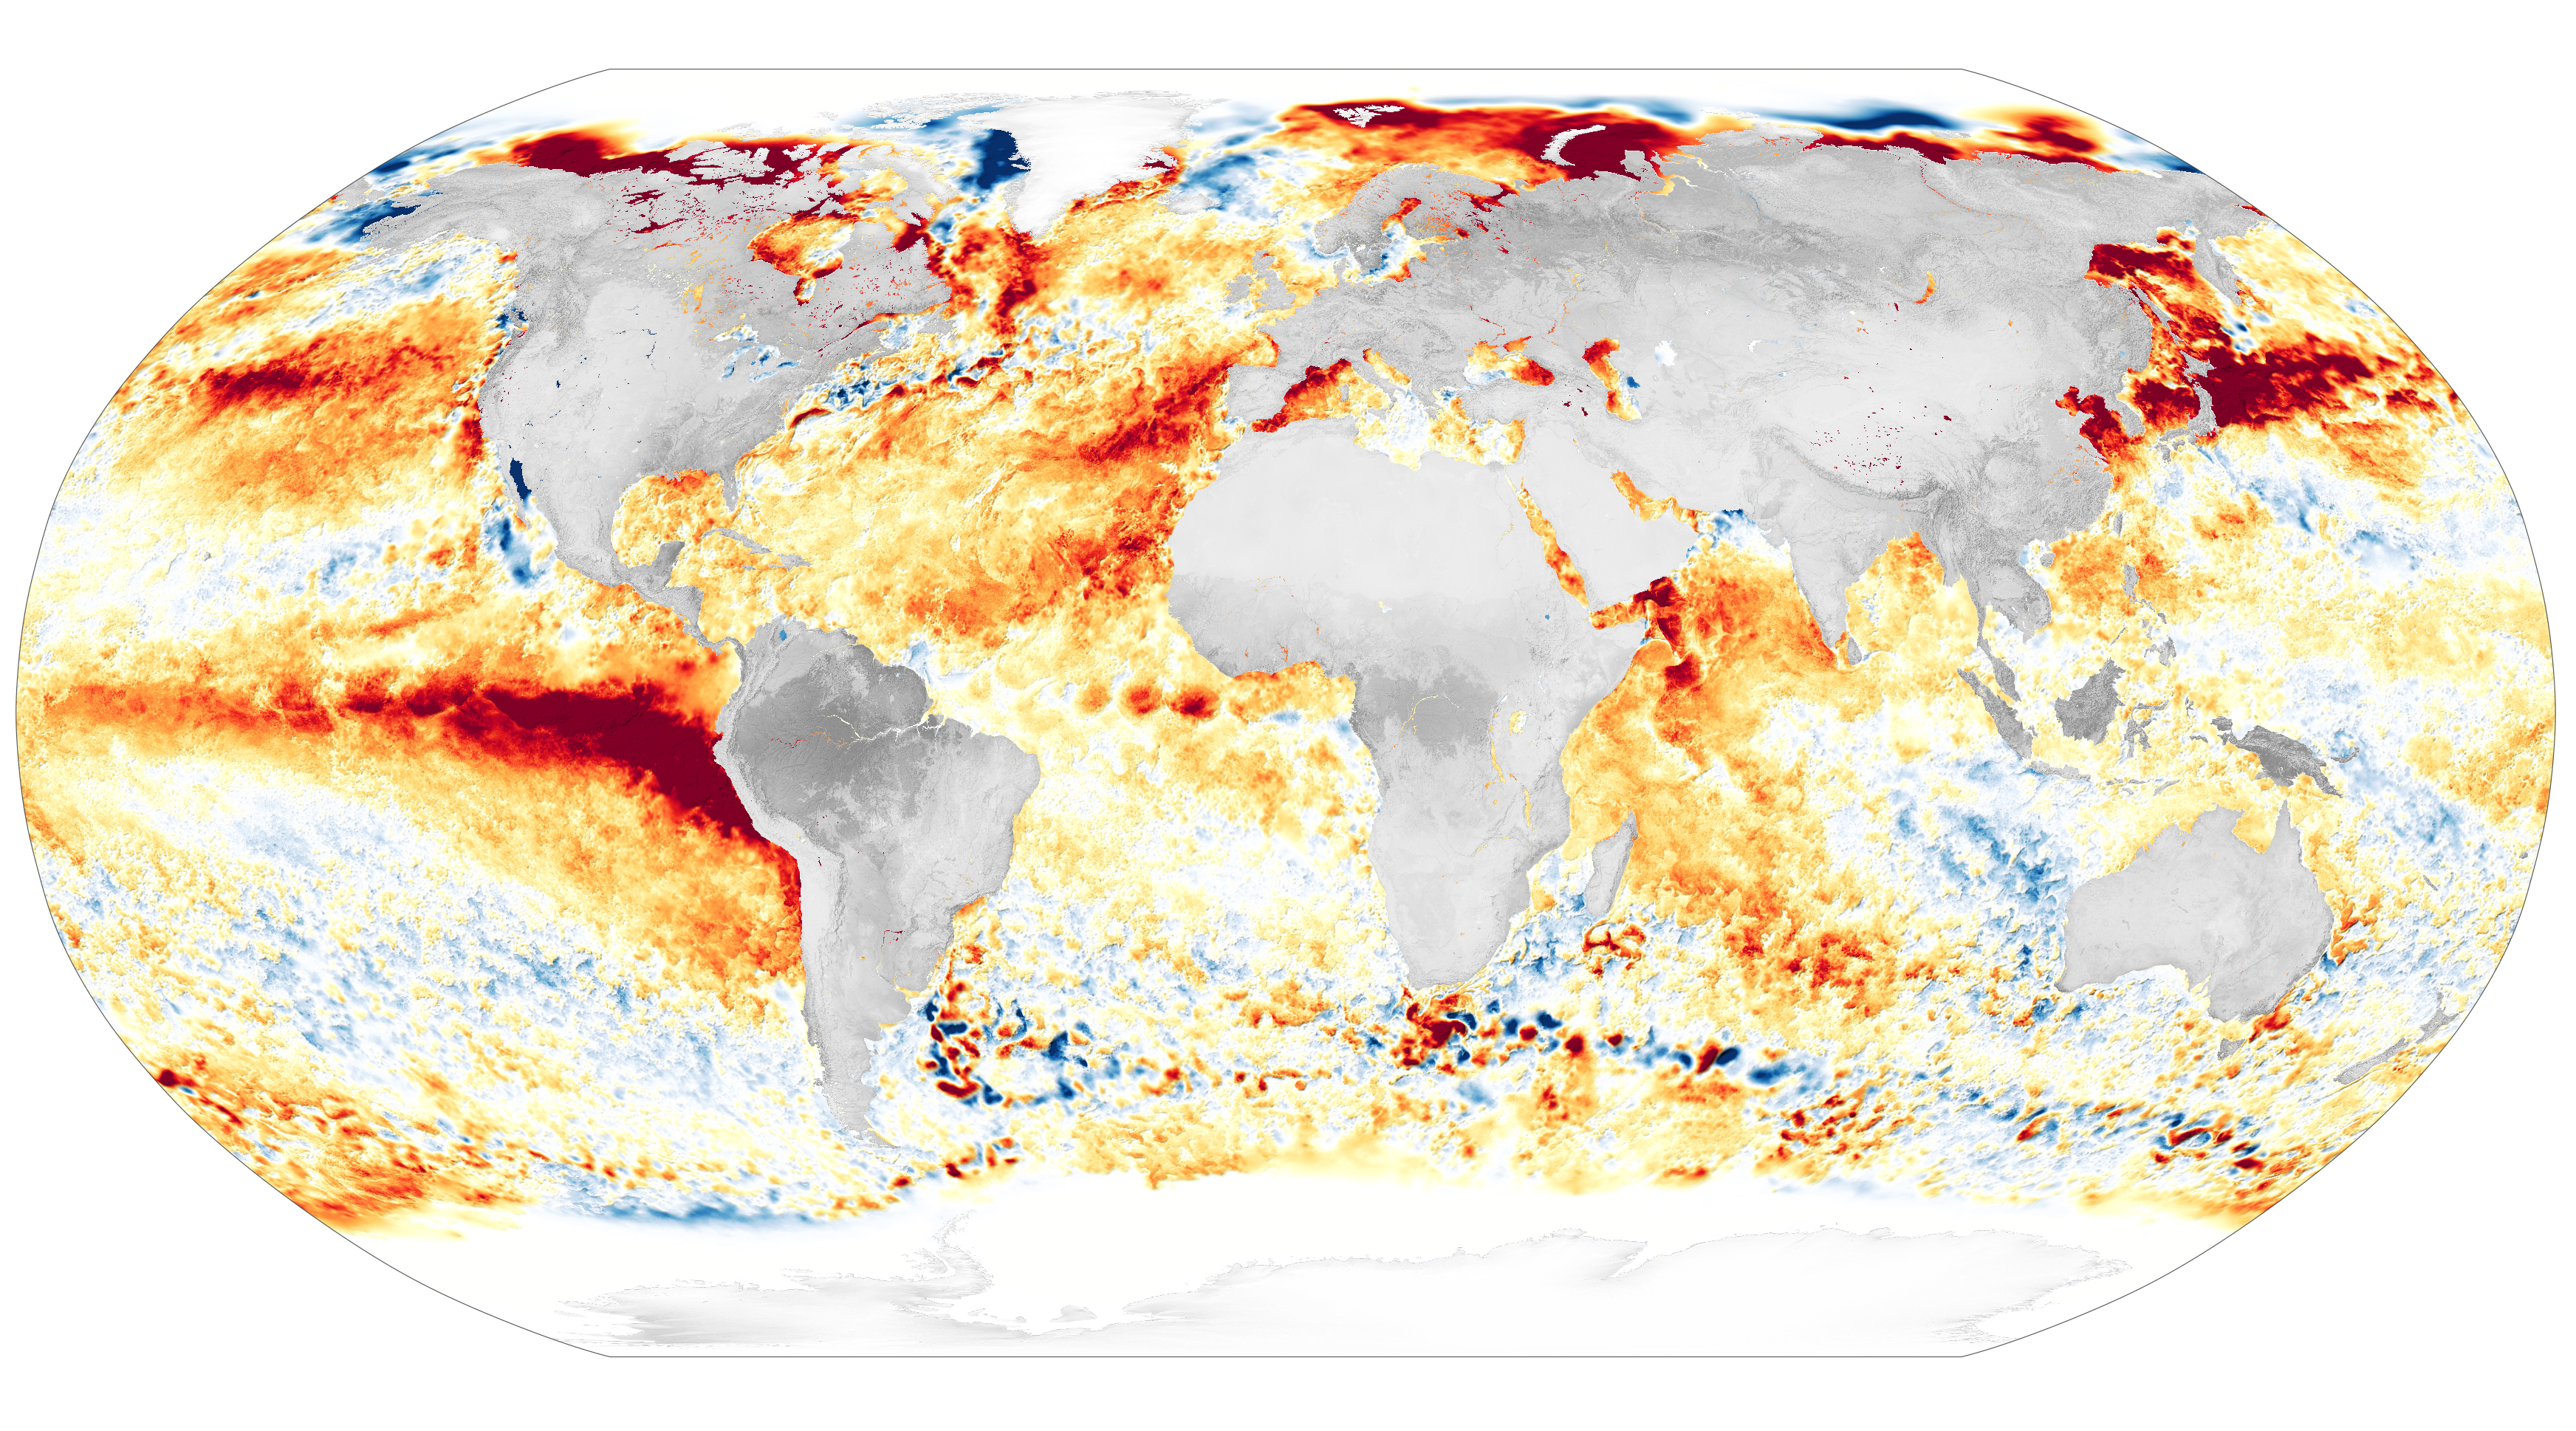
“Just like global temperatures, ocean temperatures are on the rise,” said Willis. “They have been rising for the last century or more, and they are not slowing down. If anything, they are speeding up.”
What’s behind the rise in ocean temperatures? Greenhouse gases warming the planet. Around 90 percent of the heat trapped by rising greenhouse gases is absorbed by the ocean. That means that as greenhouse gases continue to increase, so will ocean temperatures, which raises temperatures across the globe.
Aerosols are decreasing, so they are no longer slowing the rise in temperatures.
Another global trend that scientists are monitoring is a change in aerosols in the atmosphere. Aerosols are small particles in the air—such as smoke, dust, volcanic gases, sea spray, air pollution or soot—that can impact the climate. Airborne particles can either reflect sunlight, causing a slight cooling of the air, or absorb sunlight, causing a slight warming of it.
As governments have passed regulations to reduce air pollution and improve air quality, the abundance of aerosols has been decreasing in most areas. Many of these human-produced particles are the type that cool the climate slightly, so with less of them in the air, the result is a slight warming effect. But this contribution is quite small in comparison to the much greater warming from rising greenhouse gases.
Scientists at NASA and around the world are investigating how a reduction in aerosols from new shipping regulations potentially change how much solar energy is reflected back into space. While these changes can be notable on regional scales, the global impact is likely small, Schmidt said.
Scientists found that the Hunga Tonga-Hunga Ha‘apai volcanic eruption did not substantially add to the record heat.
In January 2022, the eruption of the Hunga Tonga-Hunga Ha‘apai undersea volcano blasted an unprecedented amount of water vapor and fine particles, or aerosols, into the stratosphere. Water vapor, a greenhouse gas, can produce a warming effect on the atmosphere, so scientists investigated the impact of the eruption on the global temperature. Sulfate aerosols from eruptions, on the other hand, have sometimes led to some global cooling events.
A recent study found that the volcanic sulfate aerosols reflected some sunlight away from Earth’s surface, leading to a slight cooling of less than 0.1 degrees in the southern hemisphere following the eruption. Essentially, the warming that occurred from the increase in water vapor in the stratosphere was offset by the cooling caused by volcanic sulfate aerosols leading to a slight cooling lower in the atmosphere. This means the eruption likely did not add to the record heat in 2023.
“We are very interested in the weather and extremes of any particular year because those are the things that impact us,” said Schmidt. “But the key difference between this decade and the ones before is that the temperatures keep rising because of our activities, principally the burning of fossil fuels.”
NASA Earth Observatory map (top) by Lauren Dauphin, based on data from the NASA Goddard Institute for Space Studies. Carbon dioxide animation by Helen-Nicole Kostis, NASA’s Scientific Visualization Studio. Sea surface height anomaly map by Lauren Dauphin, using modified Copernicus Sentinel data (2023) processed by the European Space Agency and further processed by Josh Willis, Severin Fournier, and Kevin Marlis/NASA/JPL-Caltech. Sea surface temperature anomaly map by Lauren Dauphin, using data from the Multiscale Ultrahigh Resolution (MUR) project. Wildland fire smoke image by Lauren Dauphin, using Terra MODIS data from NASA EOSDIS LANCE and GIBS/Worldview. Eruption image courtesy of NOAA and the National Environmental Satellite, Data, and Information Service (NESDIS). Story by Angela Colbert (NASA JPL), with Sally Younger (NASA JPL).