July 2023 was hotter than any other month in the global temperature record, according to an analysis by scientists at NASA’s Goddard Institute for Space Studies (GISS).
“This July was massively warmer than any previous July and any previous month on record, which goes back to 1880,” said GISS Director Gavin Schmidt. “This continues the long-term trend in dramatic warming that we have seen over the past four decades.”
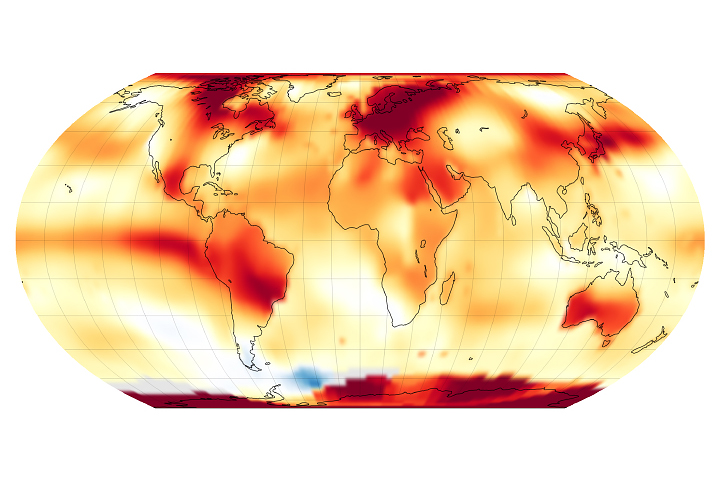
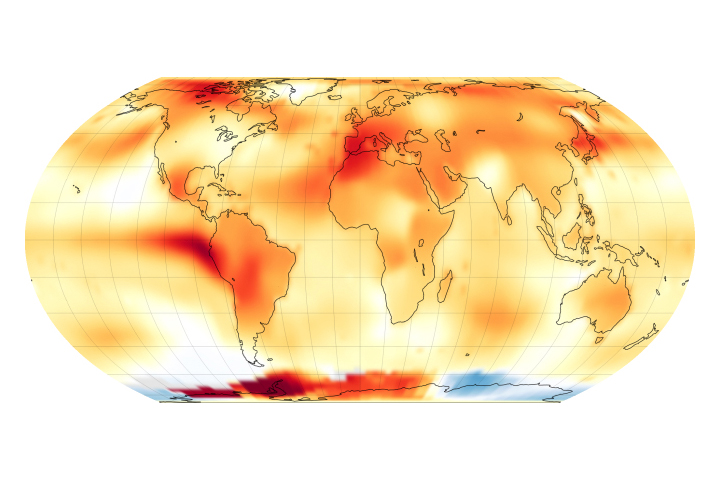
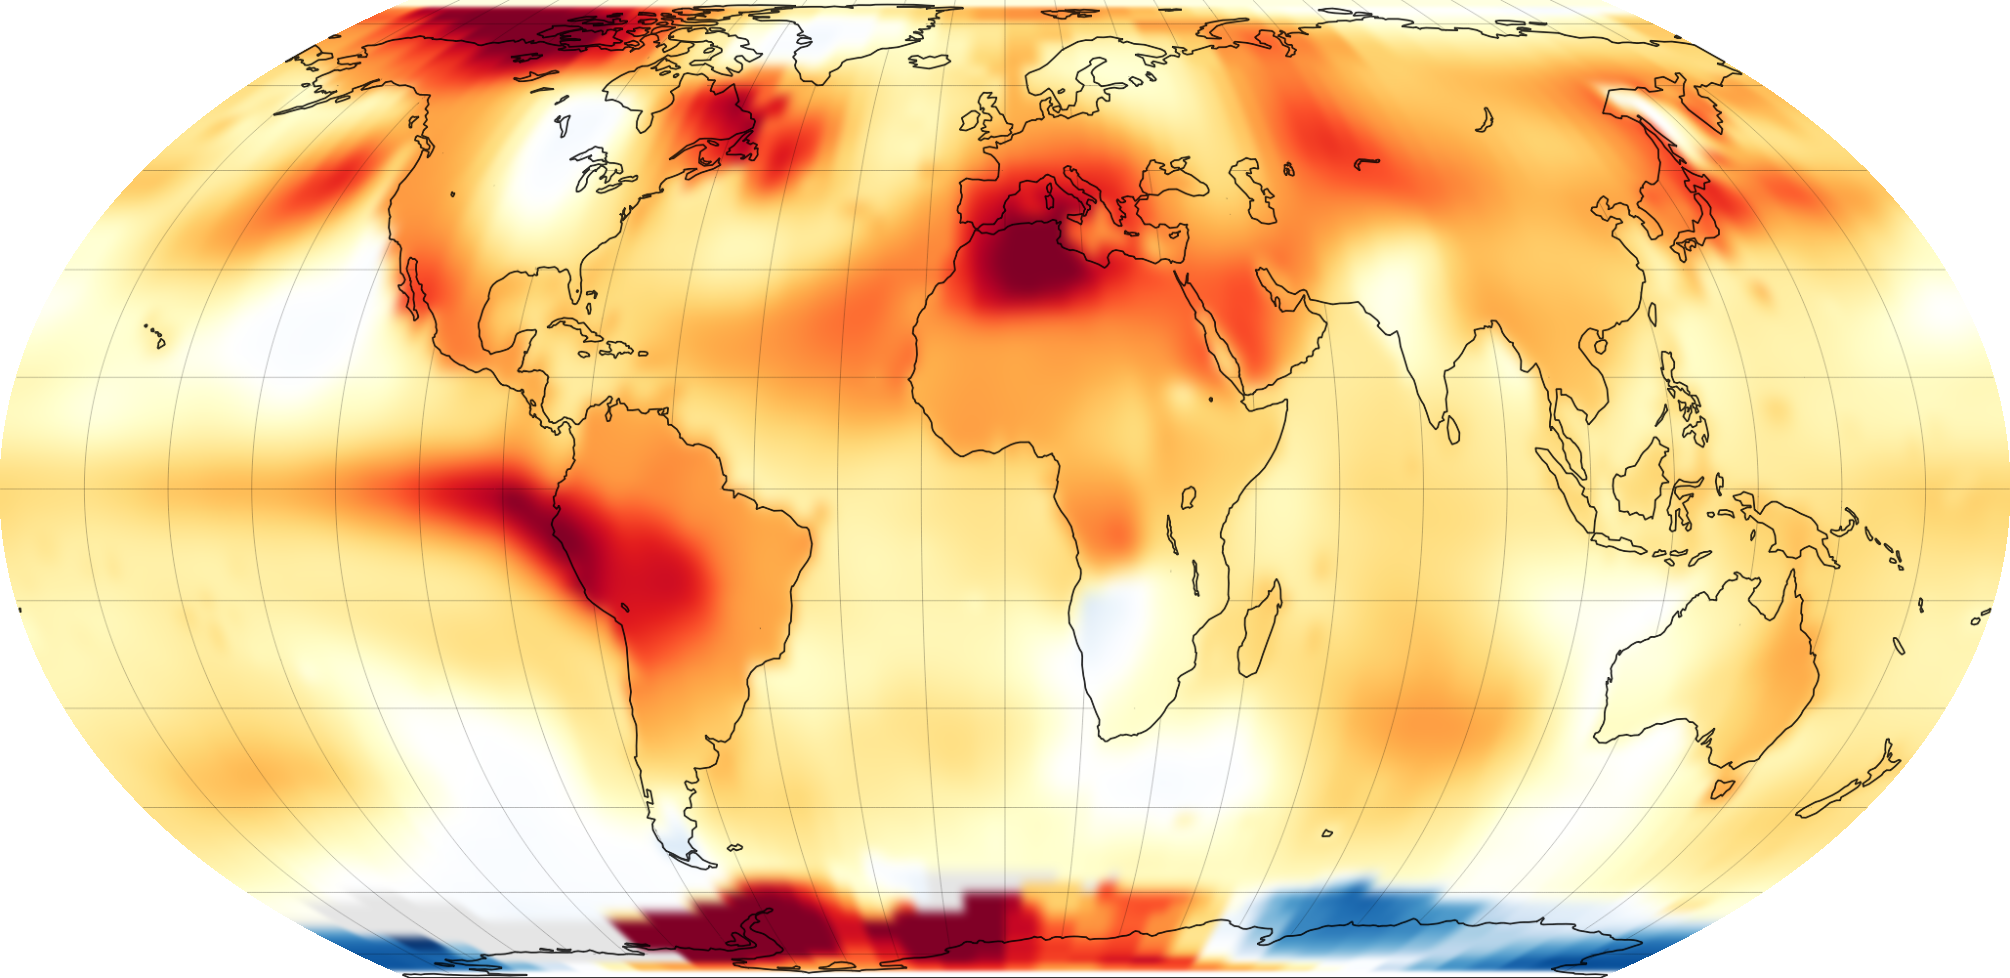
The map above depicts global temperature anomalies for July 2023. It shows how much warmer or cooler the Earth was compared to the baseline average from 1951 to 1980. Note that the deepest reds are at least 4° Celsius (7° Fahrenheit) above the monthly mean.
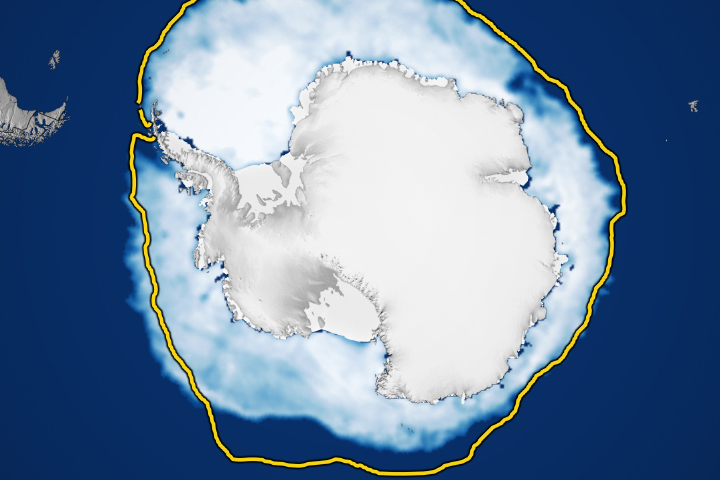
Parts of South America, North Africa, North America, and the Antarctic Peninsula were especially hot and experienced temperature anomalies around 4°C. But it was not unusually warm everywhere. Parts of the U.S. Midwest and northern Europe saw closer to average temperatures. Overall, July 2023 was 1.18°C (2.12°F) warmer than the average July between 1951 and 1980.
The warmer-than-usual July continues a long-term trend of warming, driven primarily by human-caused greenhouse gas emissions. July 2023 was 0.24°C (0.43°F) warmer than any previous July in NASA’s record. And according to GISS temperature anomaly data, the top-five hottest Julys since 1880 have all happened in the past five years.
Extreme heat contributed to devastating wildfires and blistering heat waves in the Northern Hemisphere. “These changes that we’re seeing in global temperatures are being reflected in real heat extremes that people are experiencing locally,” Schmidt said. “We can say with some confidence now that the heat waves we are seeing in North Africa, the Middle East, the U.S. Southwest, China, and southern Europe are being directly impacted by the fact that the whole planet is warming.”
The GISS team assembles its temperature analysis from surface air temperature data from tens of thousands of metrological stations and sea surface temperature data acquired by ship- and buoy-based instruments. This raw data is analyzed using methods that account for the varied spacing of temperature stations around the globe and for urban heating effects that could skew the calculations.
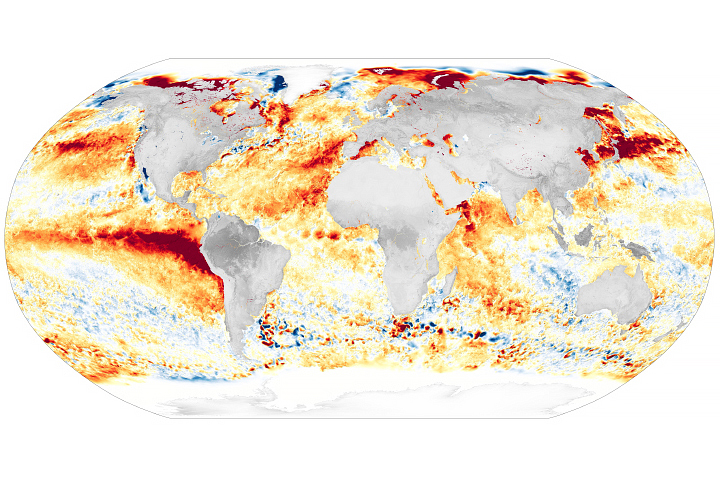
High sea surface temperatures contributed to July’s record warmth. The map shows especially warm ocean temperatures in the eastern tropical Pacific, evidence of the El Niño that began developing in May 2023. Phenomena such as El Niño or La Niña, which warm or cool the tropical Pacific Ocean, can contribute a small amount of year-to-year variability in global temperatures. But these contributions are not typically felt when El Niño starts developing during the Northern Hemisphere’s summer.
“One of the reasons this record is concerning is that the effects of El Niño on global temperatures normally have a several month lag and are felt in the winter and spring,” said Schmidt. “Even though we have an El Niño developing now, the record warmth we are seeing is not yet related to that in a significant way. We expect to see the biggest impacts of the developing El Niño in February, March, and April 2024.”
NASA’s full temperature data set and the complete methodology used for the temperature calculation and its uncertainties are available here.
NASA Earth Observatory images by Lauren Dauphin, based on data from the NASA Goddard Institute for Space Studies. Story by Emily Cassidy.