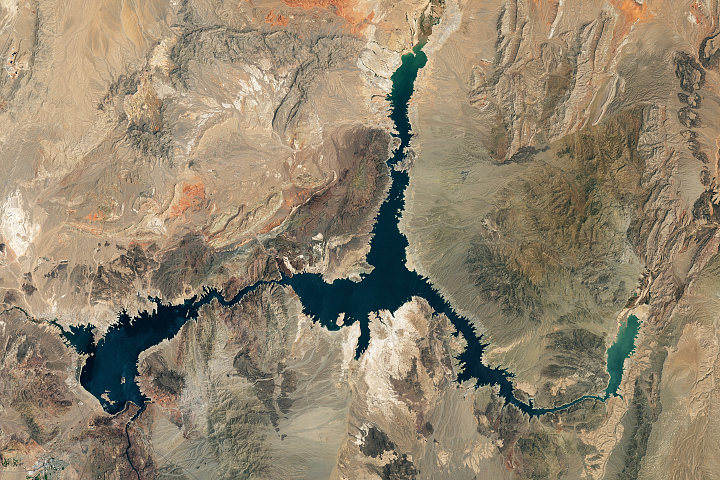
In 2022, the water level at Lake Kariba—the world’s largest reservoir and a major source of electricity in Zimbabwe and Zambia—dropped sharply. Gauges on the ground showed the water level hitting a record low on December 30, 2022. The lack of water limited electricity generation at two primary power stations, worsening rolling blackouts in both countries.
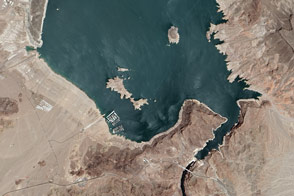
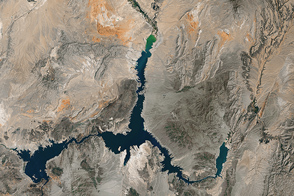
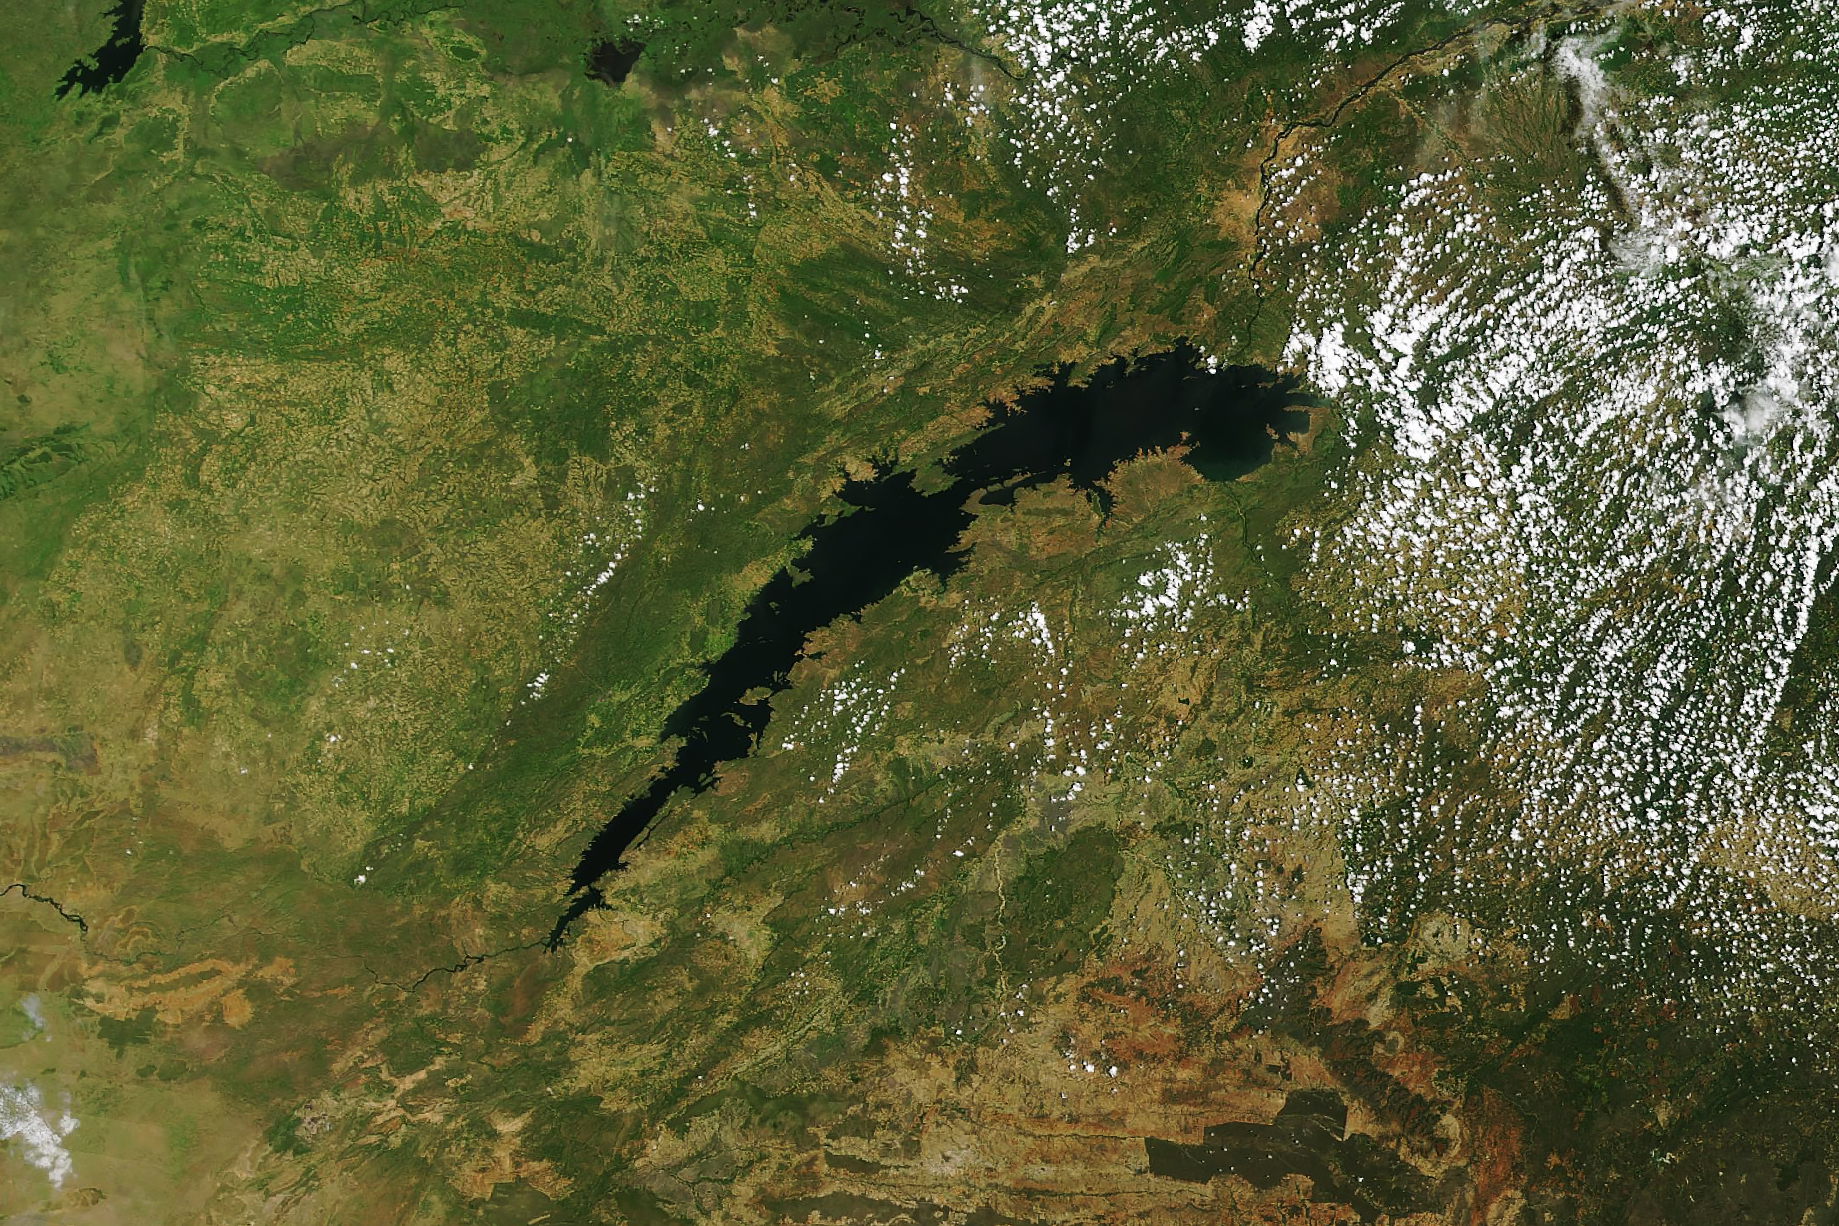
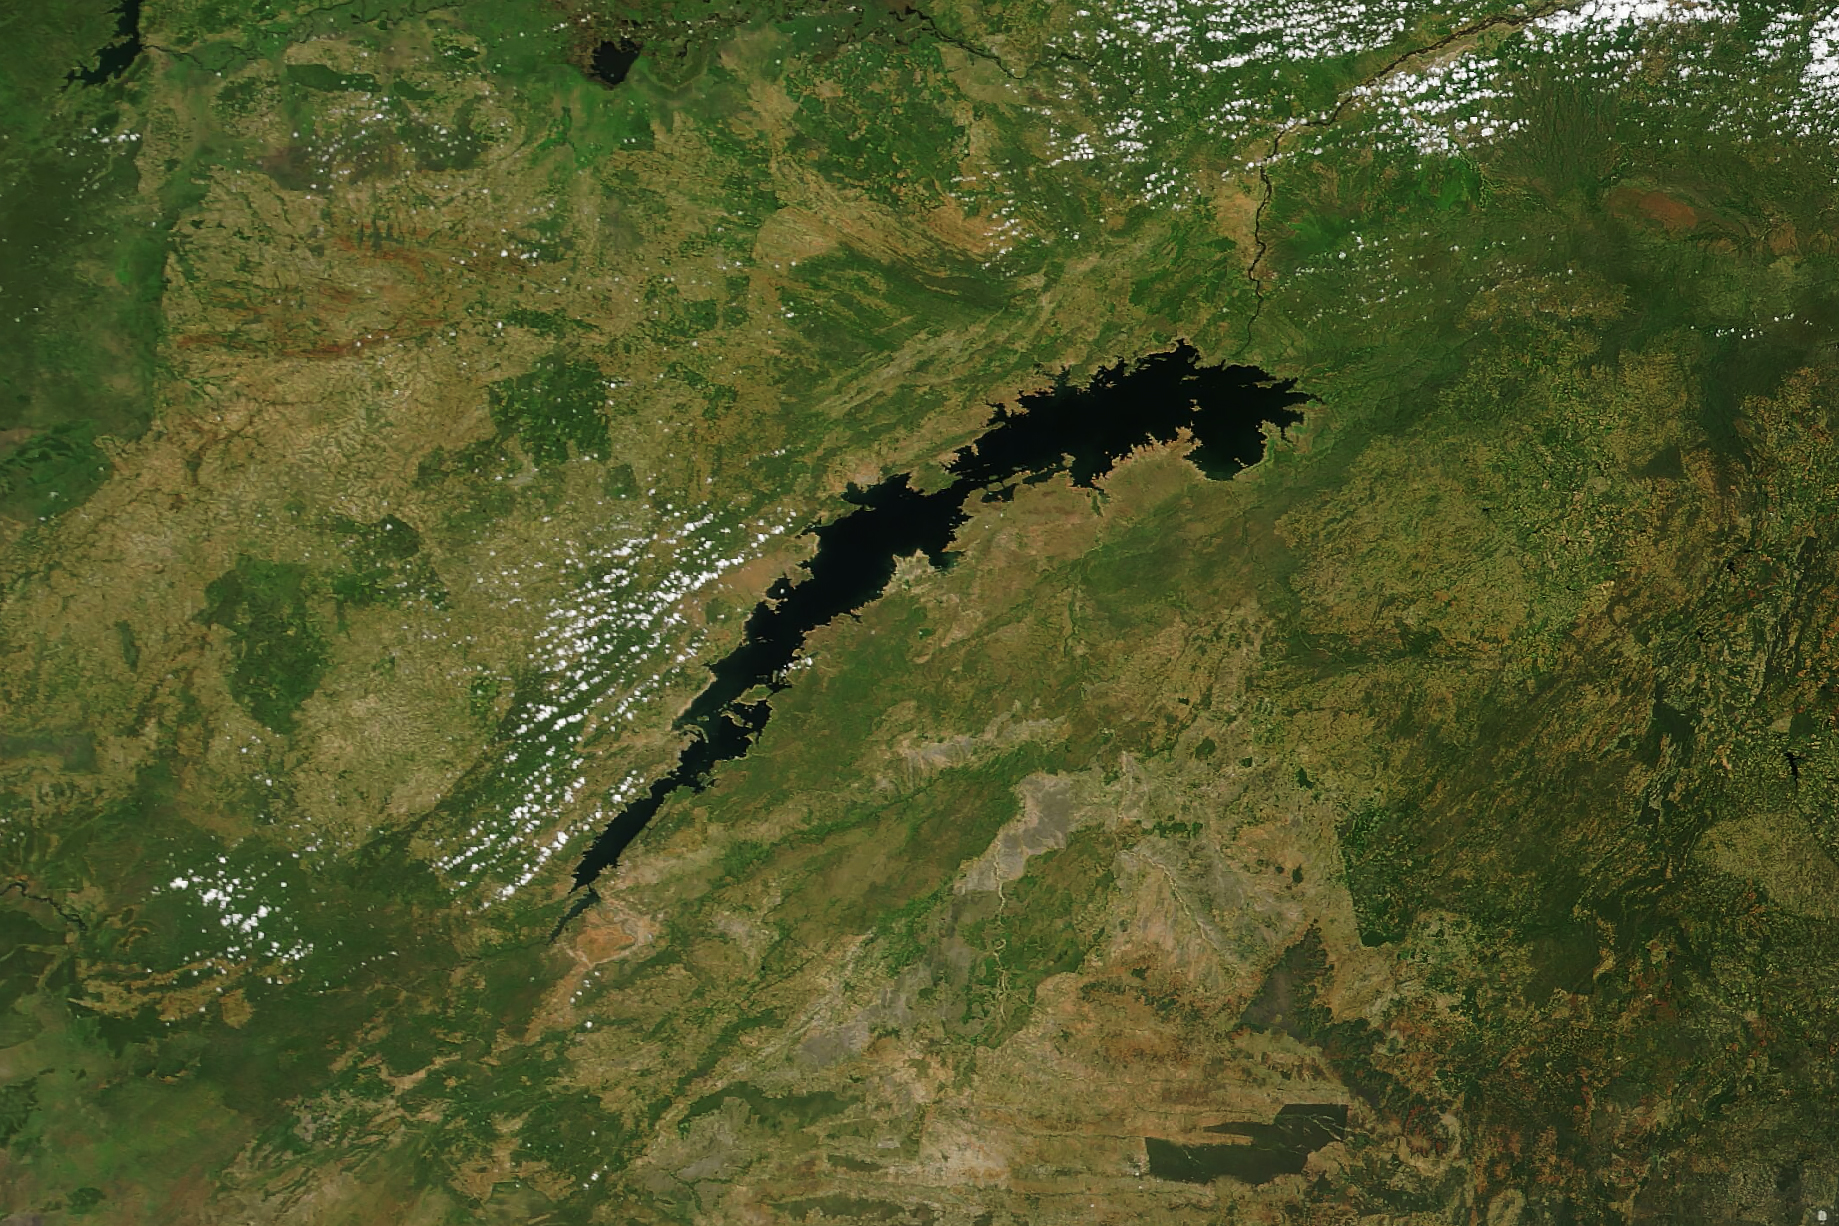
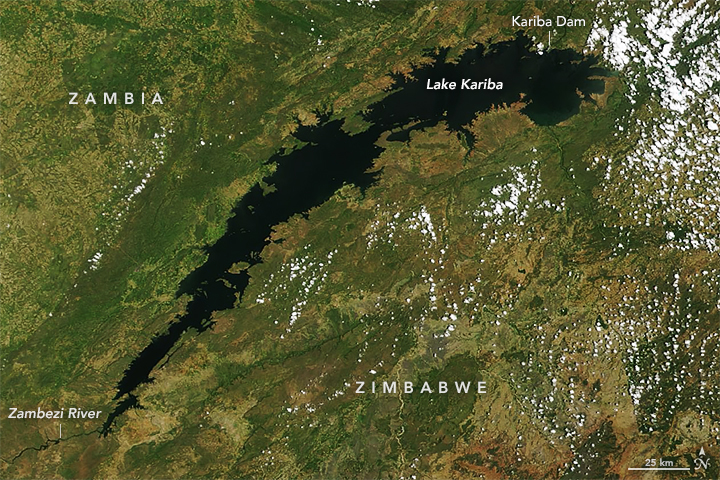
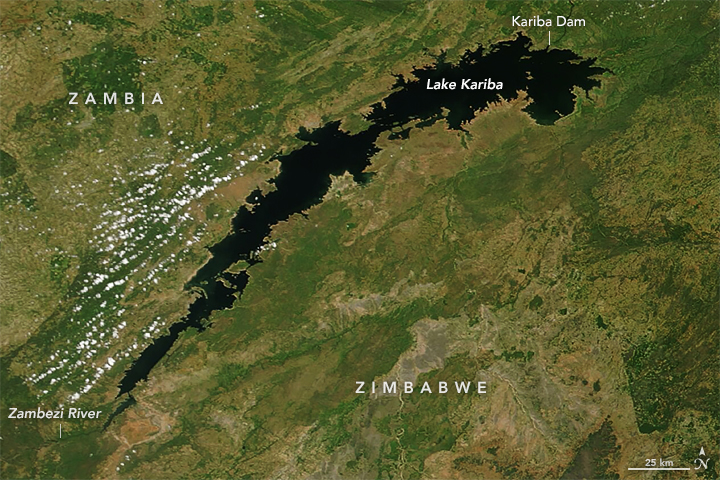
The reservoir was first filled in 1958, following the damming of the Zambezi River. Since then, it has seen several ups and downs due to variations in water use and climate patterns, but the trend over the past two decades has been for the water level to decline. The pair of satellite images at the top of the page, both acquired by the Moderate Resolution Imaging Spectroradiometer (MODIS) on NASA’s Terra satellite, show how much the reservoir shrank between January 2001 (left) and December 2022 (right). The drawdown exposed shallow areas along the fringes of the reservoir and around several islands within it.
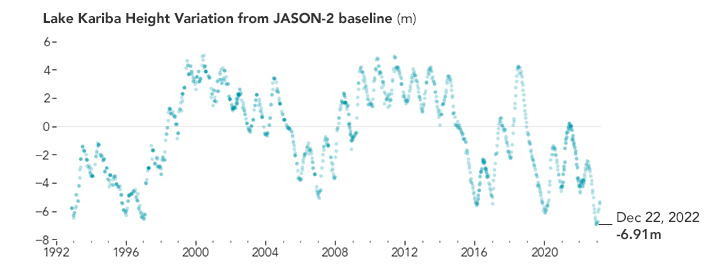
Satellites capable of detecting the height of Lake Kariba’s water have been making measurements of the reservoir since the 1990s. The chart (above) shows changes in the water level between 1992 and 2023. The decline has been particularly sharp since 2019, a period when severe drought limited recharge and the demand for water has been high. The light blue circles show water height values at roughly weekly (ten-day) intervals. They show how water heights have varied compared to reference measurements taken during the Jason-2 mission—the zero point on the Y-axis. The water level dropped 6.91 meters (22.6 feet) below the baseline—to a height of 475.48 meters—on December 22, 2022, the lowest point on the satellite record. Satellite data was not available for the next week, when ground-based water gauges showed the water level hitting the record low.
These water height data were collected by satellite altimeters, sensors that measure the distance from an orbiting spacecraft to the water surface. The TOPEX/Poseidon, Jason series, and Sentinel-6 satellites collected the data shown in the chart. The analysis was produced by scientists working with the Global Reservoir and Lake Monitor (G-REALM), a project sponsored by NASA and the U.S. Department of Agriculture Foreign Agricultural Service (FAS). FAS uses G-REALM water level measurements to assess irrigation potential and long-term drought conditions around the globe. The data are also published by NASA’s Global Water Monitor project.
Ground-based water gauge data from the Zambezi River Authority show the water level dropped to a record low of 475.60 meters on December 30, 2022. By March 13, it had increased to 477.90 meters due to the arrival of seasonal rains. The minimum operating level for power generation is 475.50 meters. Power rationing generally begins when water drops below 480 meters because the power stations are forced to start operating at a reduced capacity. The historically low water level necessitated significant load shedding and power rationing.
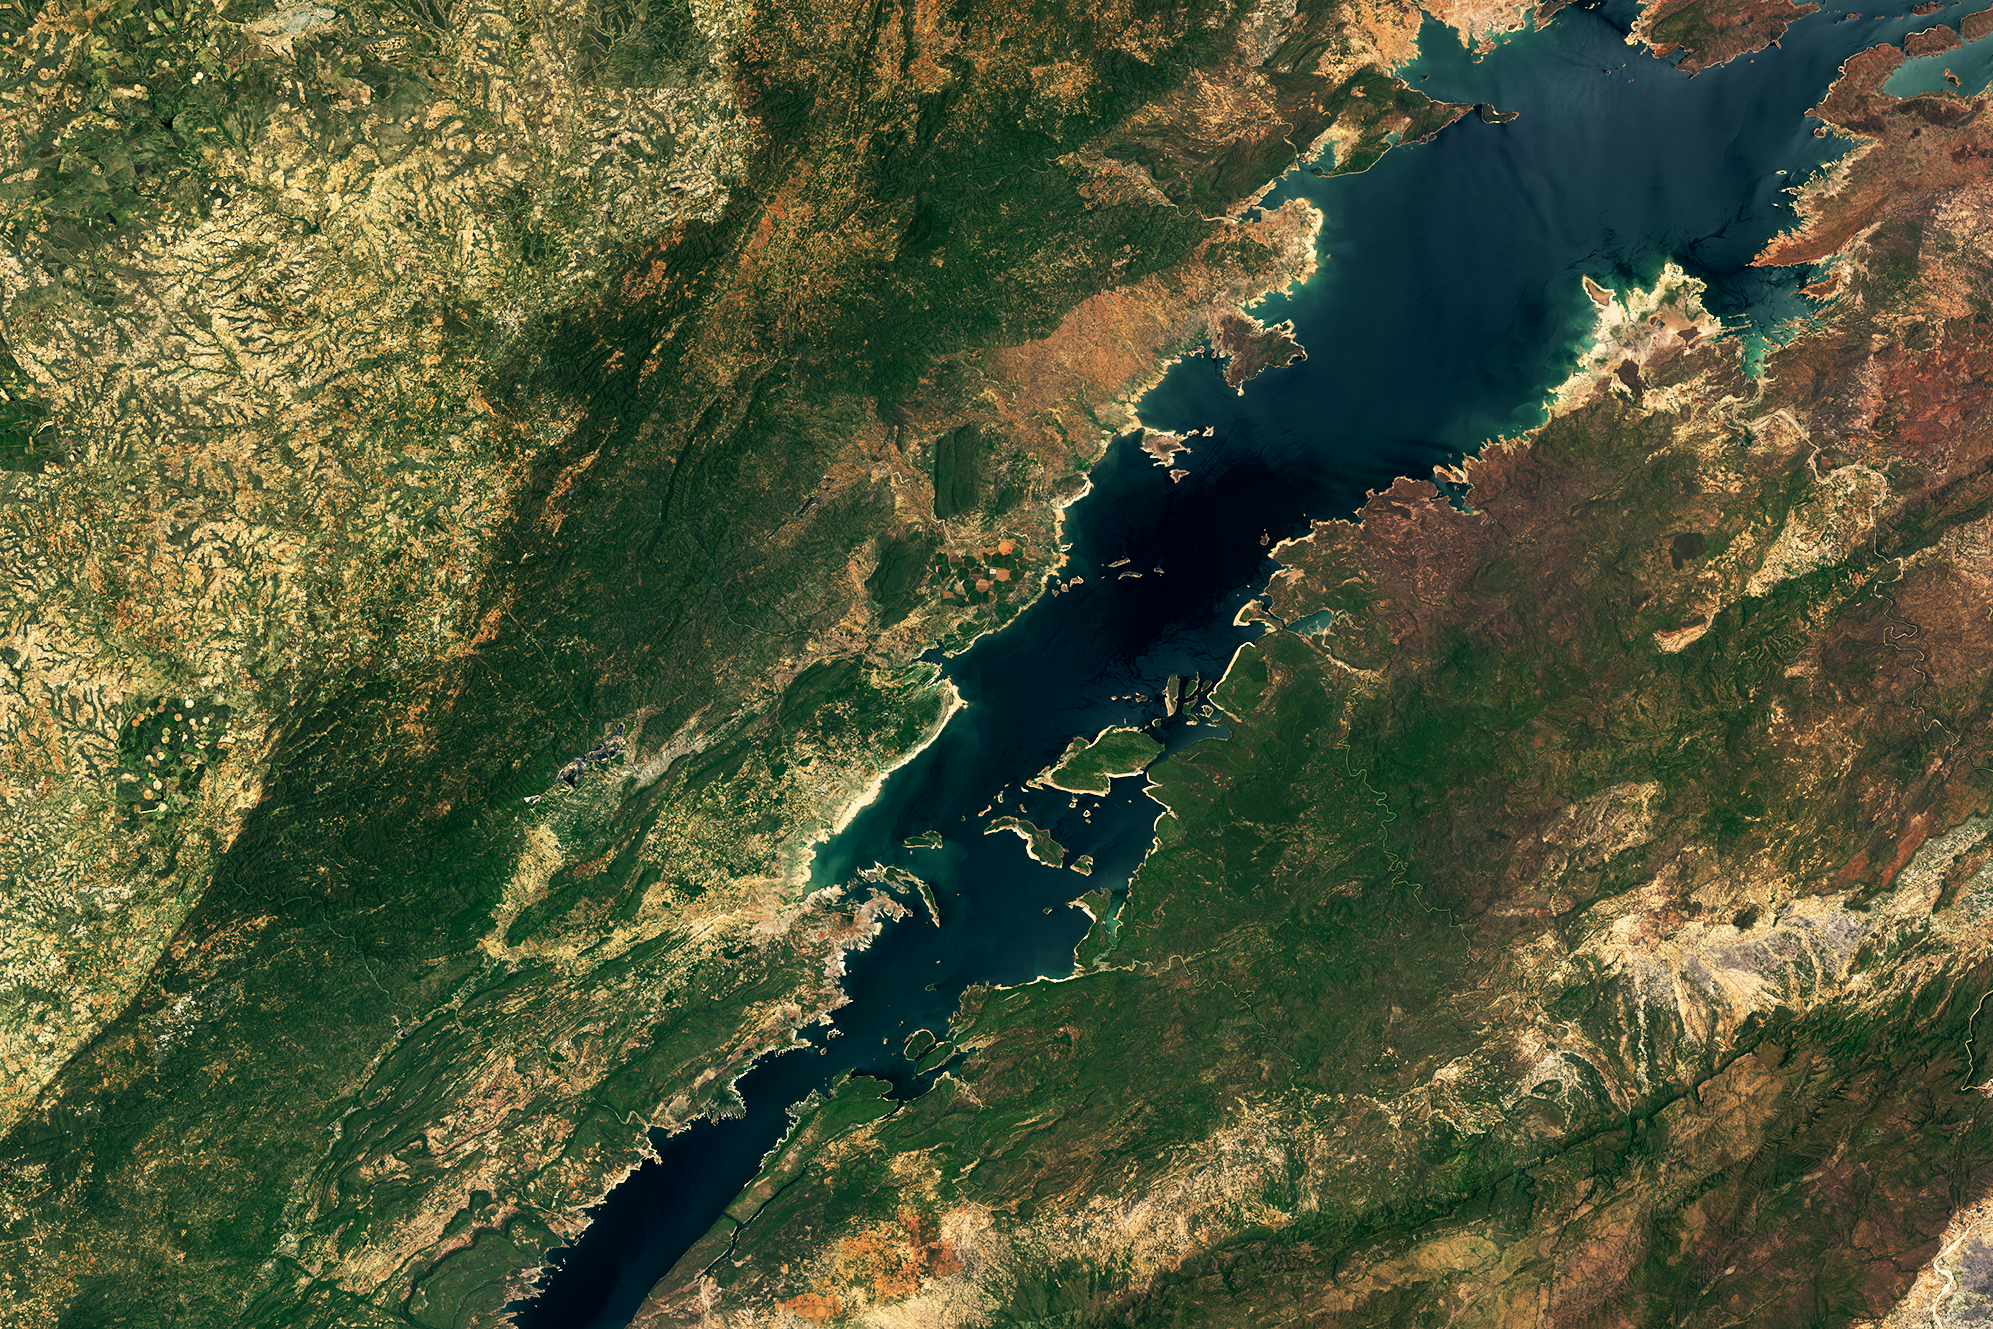
The Operational Land Imager (OLI) on Landsat 8 acquired the image (above) showing dried shoreline near Sinazeze on November 20, 2022. The light-colored fringes along the shorelines are mineralized areas of the lakeshore that were underwater when the reservoir was filled closer to capacity. The phenomenon is often referred to as a “bathtub ring.” The circular farm fields visible in the upper left of the image are part of the Nkandabbwe Irrigation Scheme, an irrigation system with open canals that was designed to give some farmers who were displaced by the filling of the reservoir a place to grow crops.
NASA Earth Observatory images by Allison Nussbaum, using MODIS data from NASA EOSDIS LANCE and GIBS/Worldview and Landsat data from the U.S. Geological Survey. Chart by Lauren Dauphin using altimetry data from the Global Water Monitor. Story by Adam Voiland.