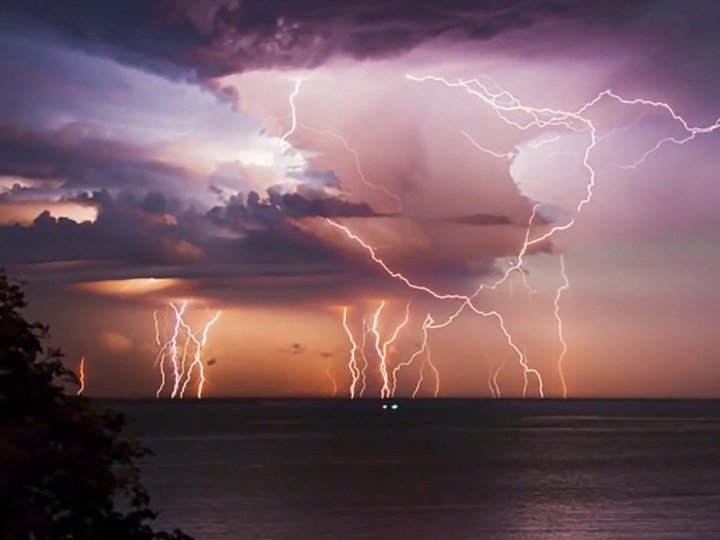
Since the dawn of humanity, lightning has been a source of both curiosity and awe. Though dozens of flashes are crackling at any moment somewhere on Earth, these brief electrical discharges—typically lasting less 30 microseconds—remain unusually challenging to study.
However, satellites have done much to deepen our understanding of lightning in recent decades. Sensors in space have provided high-quality observations of lightning flashes since the 1990s, making it possible for atmospheric scientists to quantify and map the global distribution of lightning.
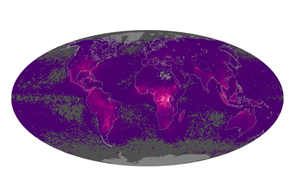
One of the first global maps of lightning activity was published in 2001 with data from the Optical Transient Detector (OTD) on the commercial OrbView-1 satellite and the Lightning Image Sensor (LIS) on NASA’s TRMM satellite. Two decades later, a second LIS mounted on the International Space Station (ISS) is adding to long-term records and making newer, better maps of global lightning activity.
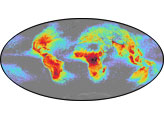
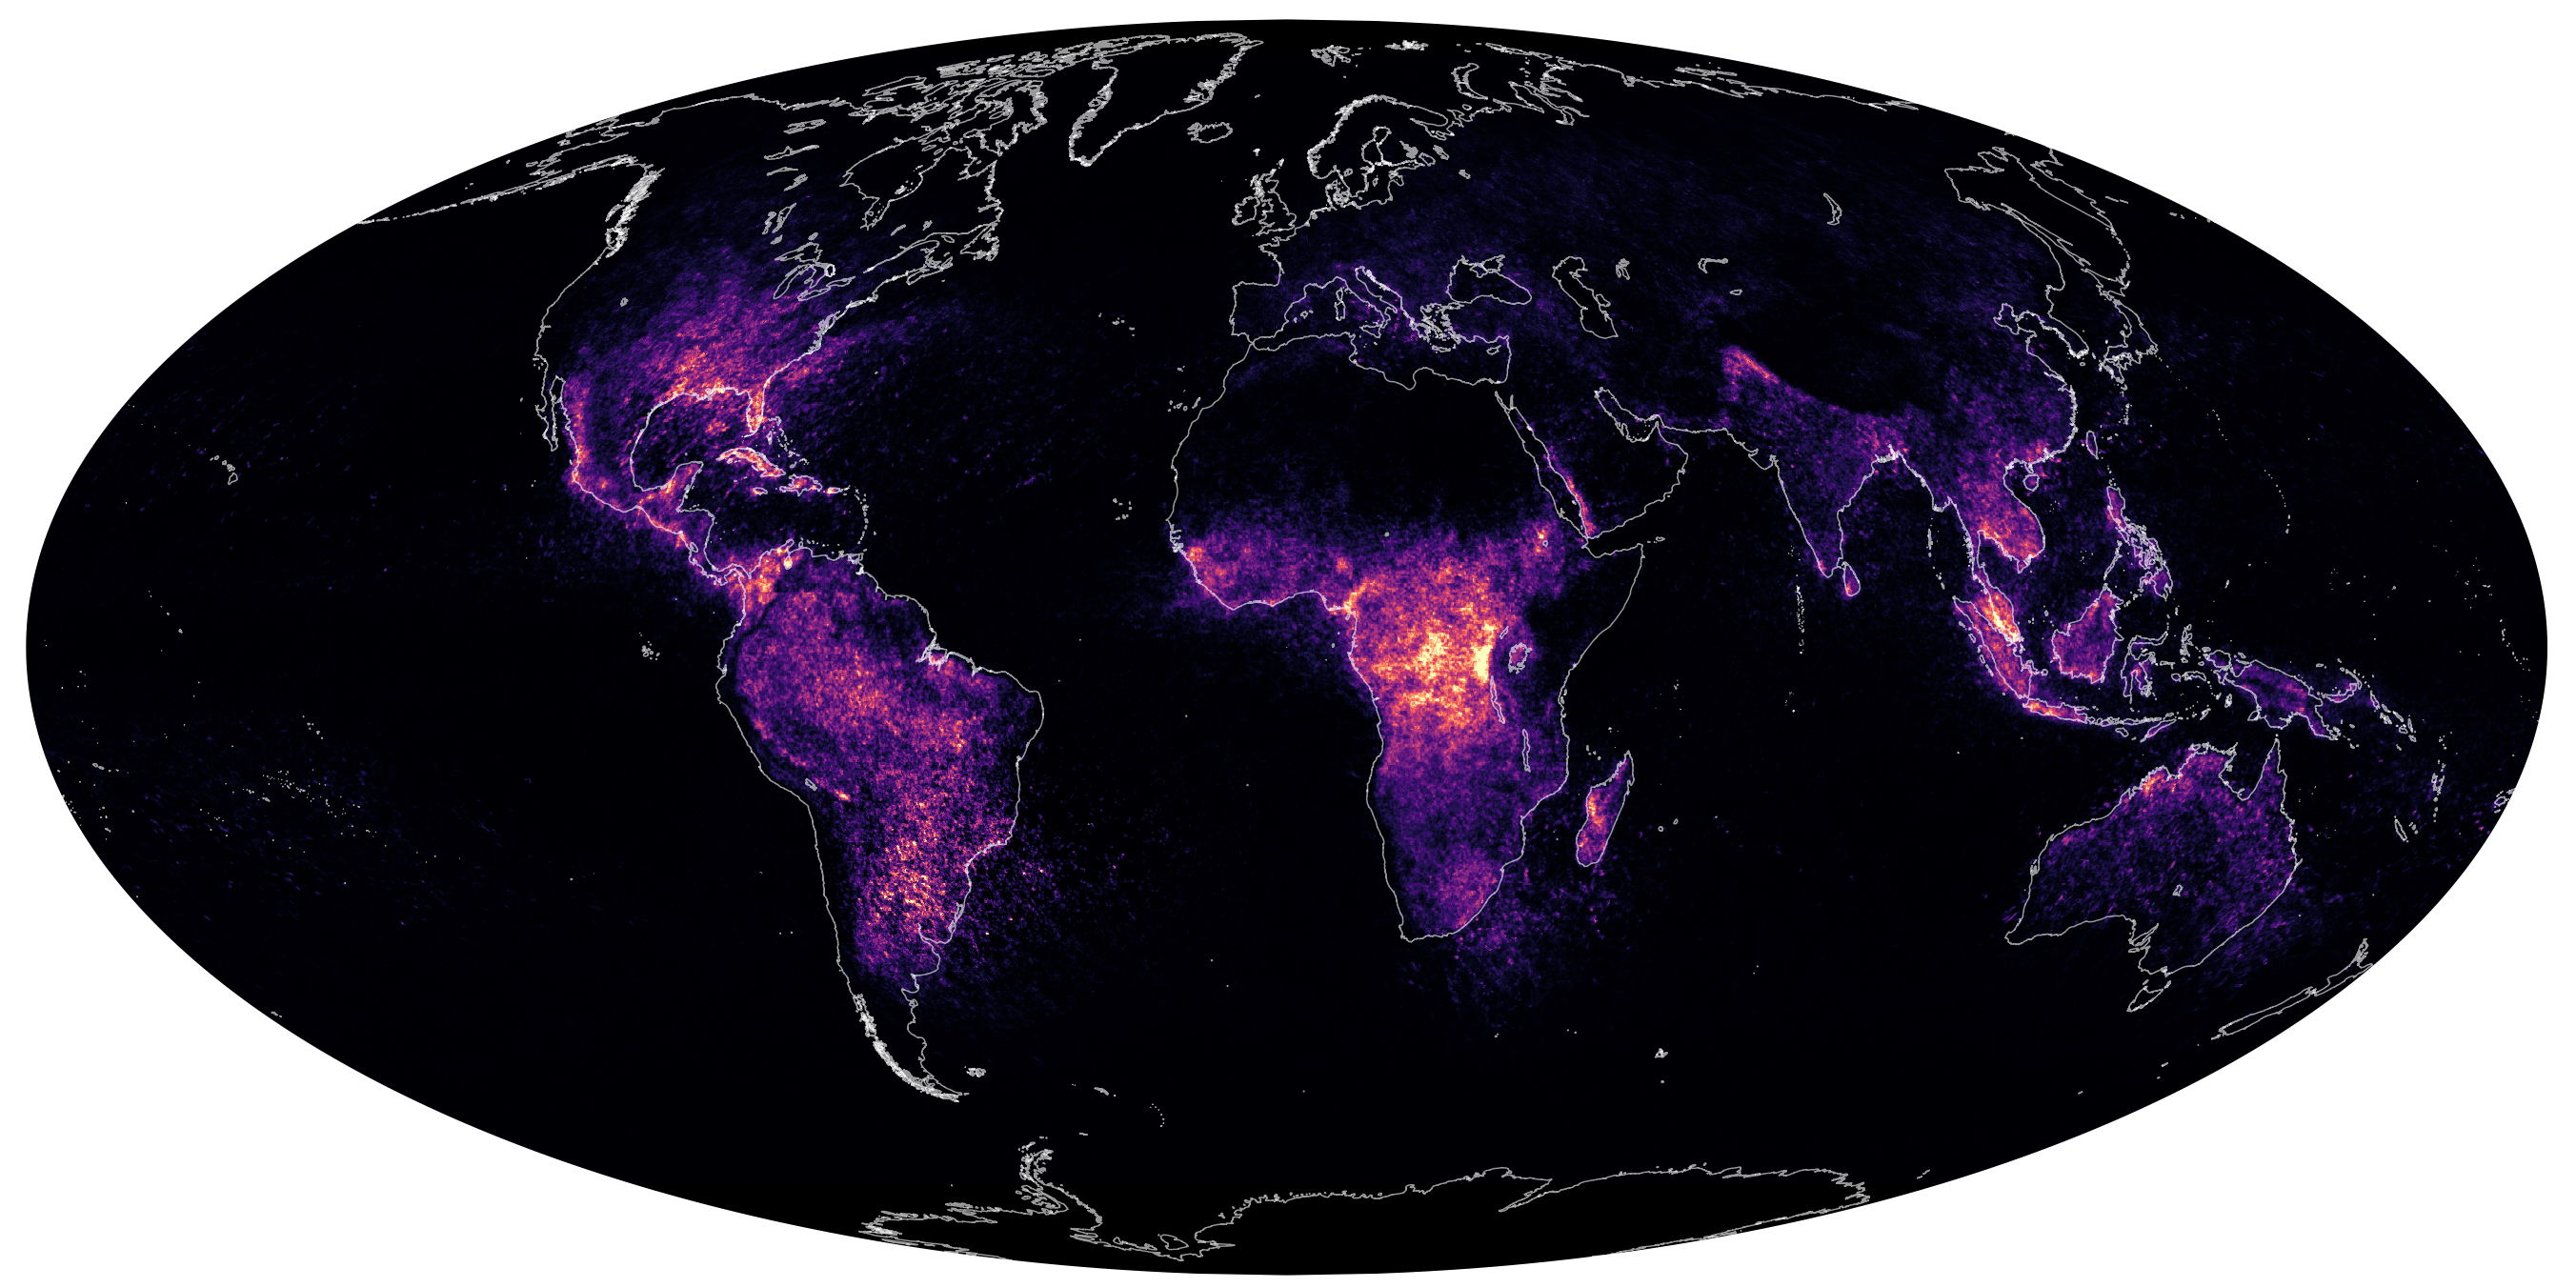
The map above draws on observations from multiple sensors—the ISS LIS, the TRMM LIS, and OTD. The TRMM LIS collected data between 1997 and 2015; OTD was operational between 1995 and 2000; and ISS LIS has been flying since 2017. Scientists from Los Alamos National Laboratory and the University of Alabama-Huntsville published an updated map in March 2021. Researchers from NASA’s Marshall Space Flight Center released a similar map of lightning activity, based on three years of ISS LIS observations, in July 2020.
“What is new and notable about the ISS LIS is that it gives us observations that are significantly farther north and south than we got from TRMM,” explained Patrick Gatlin, an atmospheric scientist at NASA Marshall. “ISS LIS observations extend to latitudes up to 55 North and 55 South, well into Canada and Patagonia.” Earlier global lightning maps made use of TRMM LIS observations that were limited to the tropics. (Researchers typically use older, lower quality data from OTD to fill gaps in high-latitude areas).
“One of the exciting things about having ISS LIS data is that we’re starting to be able to compare what is happening with lightning now to what we saw in the 1990s with OTD, and with what we saw in the 2000s and 2010s with TRMM LIS,” said Tim Lang, an atmospheric scientist at NASA Marshall. “The satellites also have a built-in advantage over ground-based networks because we don’t have gaps in the network and we have measurements over the oceans.”
Earlier lightning activity maps assigned lightning flashes a single coordinate on a map. By reprocessing all of the OTD and LIS data, scientists were able to include the horizontal dimensions. “Our analysis accounts for the fact that lightning bolts can spread horizontally, not just vertically from clouds to the ground,” explained Michael Peterson of Los Alamos National Laboratory. “One way to think about this new climatology is that it tells us the frequency that an observer can expect lightning to be visible overhead—regardless of where the flash began or ended.”
“Some lightning flashes—we call them megaflashes—actually propagate for incredibly long horizontal distances, sometimes for hundreds of kilometers,” Peterson added. The longest lightning bolt ever recorded spanned 709 kilometers (440 miles) as it crackled through skies over Argentina and Brazil for 11 seconds in 2018.
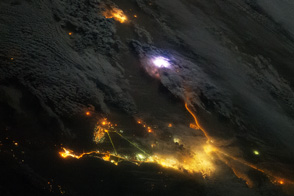
Though the new approach does change some details of how we understand lightning, the overall patterns remain similar to before. With an average flash rate of 389 per day, Lake Maracaibo in northern Venezuela (shown above) has the highest flash extent density in the world. That region’s unique geography fuels weather patterns that make it a magnet for thunderstorms and lightning. The area along Lake Kivu, on the border of Rwanda and the Democratic Republic of Congo, is a close second with an average of 368 flashes per day.
While researchers are still in the process of harmonizing the various data records, they are optimistic that satellite data will prove useful for identifying trends in lightning activity. They are also hopeful that they will be able to pinpoint whether climate change is affecting lightning. Some scientists anticipate that patterns will change as the world warms and weather fronts and storm tracks adjust. By contributing to the production of nitrogen dioxide, a greenhouse gas, lightning is also a direct contributor to global warming. “There is added urgency to look at climate change’s effect on lightning because the World Meteorological Agency recently added lightning to its list of essential climate variables,” said Lang.
NASA Earth Observatory image by Lauren Dauphin, using data from Peterson, et al. (2021). Photograph by NASA. Story by Adam Voiland.