On August 4, 2020, a devastating explosion rocked the port area around Beirut, Lebanon. After the event, scientists used satellite radar imagery to map the extent of the damage and help identify areas where people may need assistance.
According to the Associated Press, a fire near the port ignited a large nearby store of ammonium nitrate, a highly explosive chemical often used in fertilizer. At least 135 people died, about 5,000 were wounded, and at least 300,000 people were left homeless. Losses from the blast are estimated to be at least $10 to $15 billion, according to news reports.
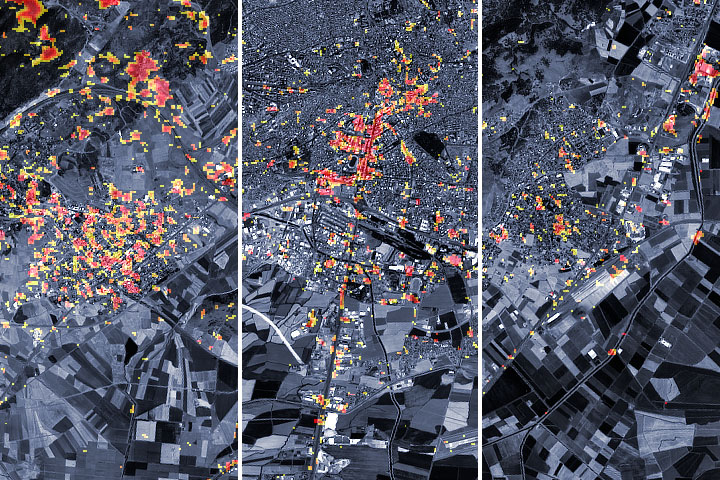
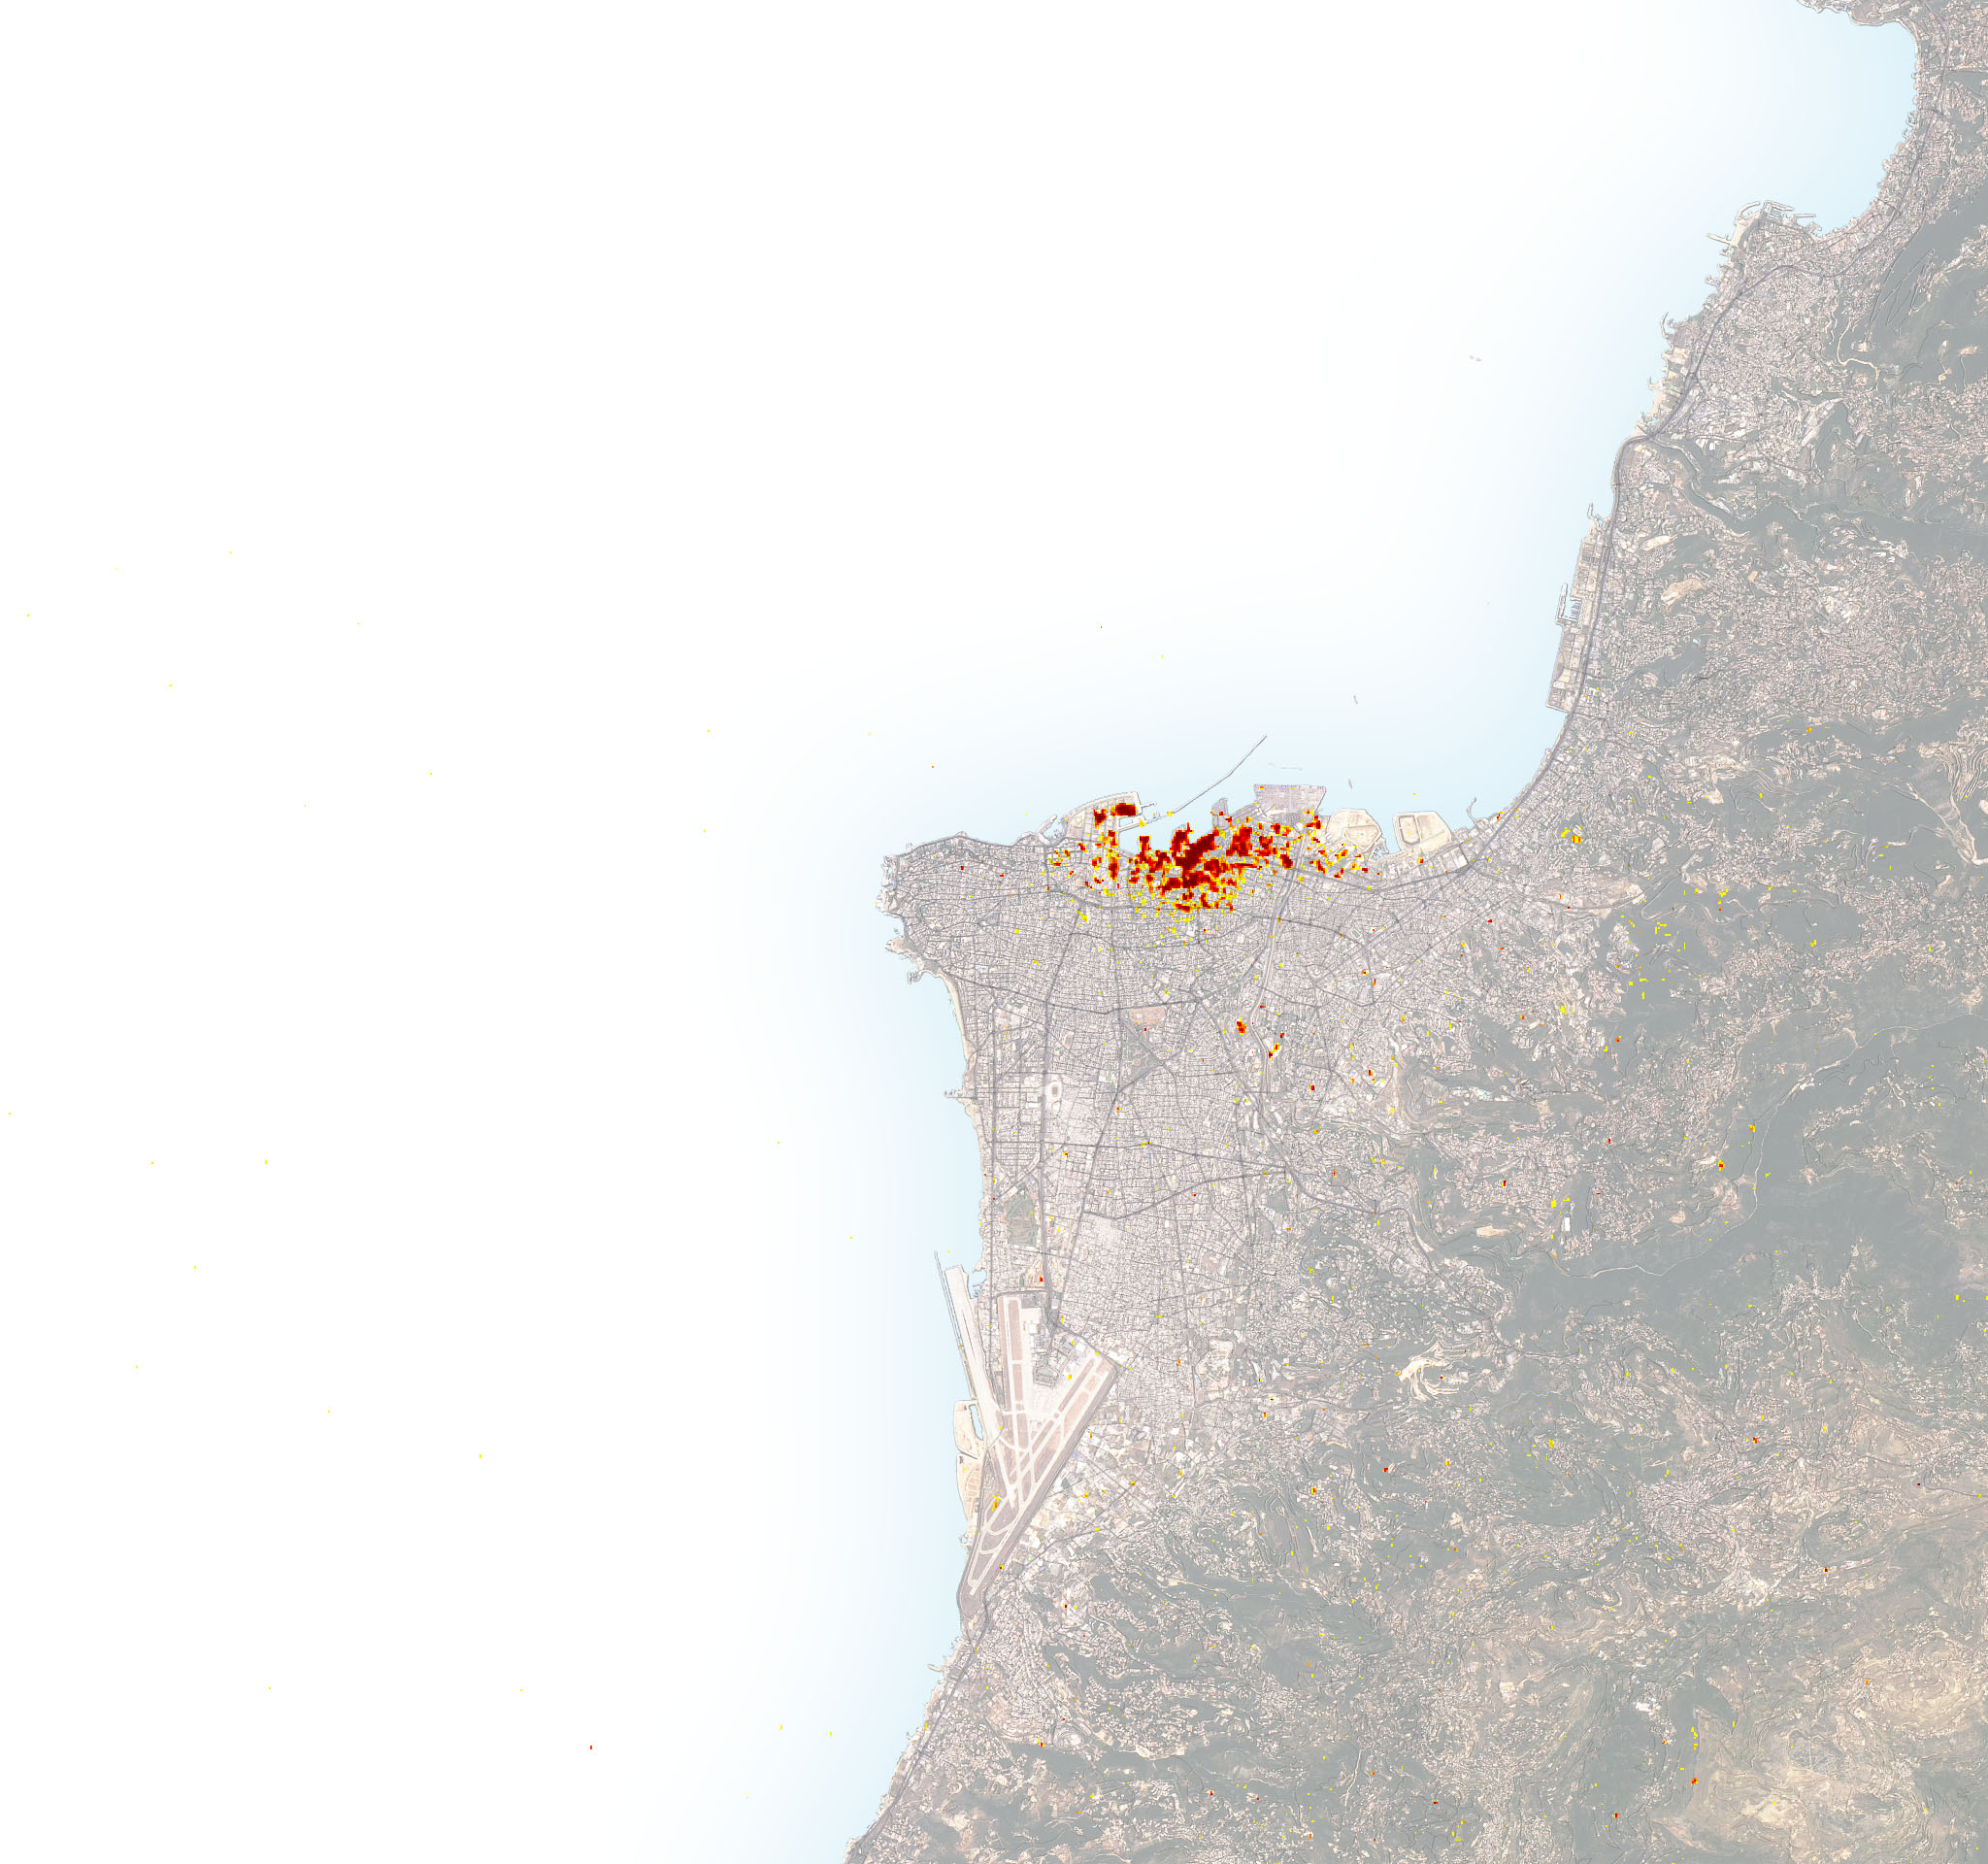
The image above is a damage proxy map created by scientists affiliated with NASA’s Advanced Rapid Imaging and Analysis (ARIA) team and the Earth Observatory of Singapore (EOS). Dark red pixels represent the most severe damage, while orange and yellow areas are moderately or partially damaged. Each colored pixel represents an area of 30 meters by 30 meters (about the size of a baseball infield).
The team at ARIA (NASA Jet Propulsion Laboratory) and EOS examined synthetic aperture radar (SAR) data collected before and after the explosion, mapping changes in the land surface and built structures. SAR instruments send pulses of microwaves toward Earth’s surface and listen for the reflections of those waves. The radar waves can penetrate cloud cover, vegetation, and the dark of night to detect changes that might not show up in visible light imagery. When Earth’s crust moves due to an earthquake, when dry land is suddenly covered by flood water, or when buildings have been damaged or toppled, the amplitude and phase of radar wave reflections changes in those areas and indicates to the satellite that something on the ground has changed.
Though other U.S. and international agencies play more immediate roles in response to disasters, NASA plays a role in providing observations and analysis. Over the past decade, NASA has actively built its capacity to share Earth observations that can improve the prediction of, preparation for, response to, and recovery from natural and technological disasters. For instance, NASA often responds to calls for data and imagery from the International Charter for Space and Major Disasters.
“We look at areas of likely exposed populations and fragile infrastructure, as well as areas subject to social stresses and crises. We model and map risks, while also tracking emissions, debris, infrastructure damage, and other effects from things like volcanic eruptions, fires, industrial accidents, earthquakes, and floods,” said David Green, head of NASA’s Disasters Applications team. “Our observations and analyses can help our partners increase their situational awareness of systemic risks and of real-time events, leading to better-informed decisions and early action.”
NASA Earth Observatory image by Joshua Stevens, using modified Copernicus Sentinel data (2020) processed by ESA and analyzed by Earth Observatory of Singapore (EOS) in collaboration with NASA-JPL and Caltech, Landsat data from the U.S. Geological Survey, and data from OpenStreetMap. Story by Esprit Smith, NASA's Earth Science News Team, and Michael Carlowicz.