
Editor’s Note: This story is excerpted from our recent feature, Could COVID-19 Have Seasons? Searching for Signals in Earth Data.
In 400 BC, the renowned Greek physician Hippocrates offered the earliest known account of a seasonal respiratory disease. The “Cough of Perinthus” was a winter affliction that hit a port city in Greece. Symptoms included fevers, chills, labored breathing, pneumonia, and sometimes death.
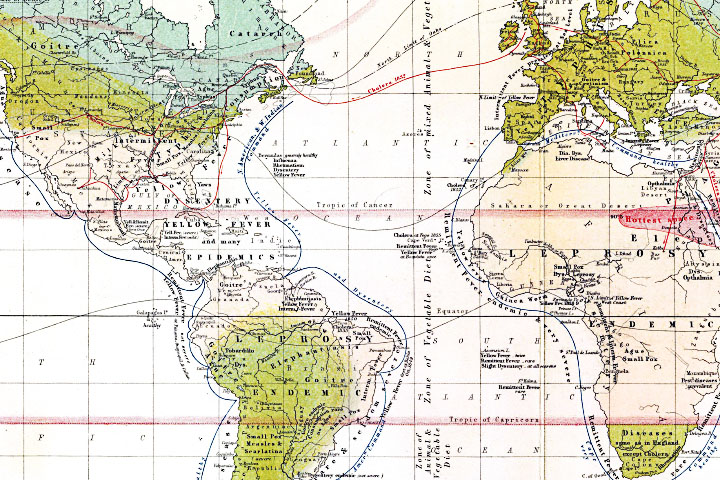
In 1856, the Scottish geographer Alexander Keith-Johnston depicted how some prominent viruses and other diseases were thought to vary in relation to temperature and latitude (see the map below). Modern scientific tools have allowed us to observe and explain disease in ways that may have astounded Hippocrates and Keith-Johnston. But explaining why some disease outbreaks have seasonal cycles, and predicting the timing of those cycles, remains a challenging problem.
In 2020, solving that problem became even more pressing, as a novel coronavirus (SARS-CoV-2) and the respiratory disease it causes (COVID-19) spread rapidly around the world.
Research has shown over the years that some respiratory viruses have clear seasonal rhythms. For instance, cases of influenza and several types of coronaviruses are known to surge in the winter. Outbreaks of enteroviruses usually happen in the summer. And some adenoviruses and rhinoviruses have no obvious seasonal cycle. The question confronting infectious disease experts and policymakers is: how will SARS-CoV-2 behave?

NASA has joined other U.S. and international agencies in hunting for answers. For instance, Benjamin Zaitchik, a Johns Hopkins University researcher working on a NASA Earth Applied Sciences project, is investigating potential relationships between the spread of the novel coronavirus and seasonal shifts in humidity, temperature, rainfall, and other environmental variables. He hopes the work will clarify the role that weather and climate might play in influencing the spread of the virus.
One way that Zaitchik and other researchers hope to get some clarity is by making use of reanalysis datasets and models—such as the ERA-5 from the European Centre for Medium-Range Weather Forecasts (ECMWF) and the Modern Era Retrospective-Analysis for Research and Applications (MERRA-2) from NASA—that synthesize disparate environmental data into a coherent whole. These systems generate consistent snapshots of Earth’s atmosphere and land and water surfaces over large areas and long time periods.
“There really is no more accurate and spatially consistent four-dimensional snapshot of the atmosphere than what you get from these reanalysis products,” said Rob Gelaro, a research meteorologist with NASA’s Global Modeling Assimilation Office, which runs MERRA-2. “Every six hours, MERRA-2 absorbs at least 5 million observations and generates a snapshot of the global atmosphere for a given moment.”
The animation above highlights data from NASA models of temperature and humidity—two variables that may be relevant to how the novel coronavirus spreads—and how they change over the course of a year. “We are using these models to look closely at temperature and humidity data, but we are not stopping with that,” said Zaitchik. “We will also be looking at several other parameters—rainfall, soil moisture, evapotranspiration, winds, surface pressure, evaporative fraction, and UV exposure—that might help us detect a signal or understand something about disease transmission.”
Read more in our feature, Could COVID-19 Have Seasons? Searching for Signals in Earth Data.
NASA Earth Observatory animation by Joshua Stevens, using GEOS-5 data from the Global Modeling and Assimilation Office (GMAO) at NASA GSFC. Historic map by Alexander Keith-Johnston courtesy of the David Rumsey Map Collection. Story by Adam Voiland.