The Earth Observatory has published its last Image of the Day on this website. Please join us on our new home at science.nasa.gov/earth/earth-observatory.
The amount of methane in Earth’s atmosphere continues to rise. That is the conclusion of two new studies from the Global Carbon Project.
Researchers synthesized all known data about methane from emissions inventories, atmospheric measurements, and models to assemble a global “methane budget” that details which processes add the gas to the atmosphere and which remove it. They found that global emissions of the potent greenhouse gas totaled 576 million metric tons per year for the 2008 to 2017 decade—a 9 percent increase compared to the previous decade.
The rapid growth builds upon the rise in the atmospheric concentration of the gas that has been happening for more than a century. (Emissions briefly stabilized between 2000 and 2006.) Concentrations of methane now exceed 1875 parts per billion, about 2.5 times as much as was in the atmosphere in the 1850s. Climate scientists estimate that the gas is responsible for about one quarter of the global warming that has happened since then.
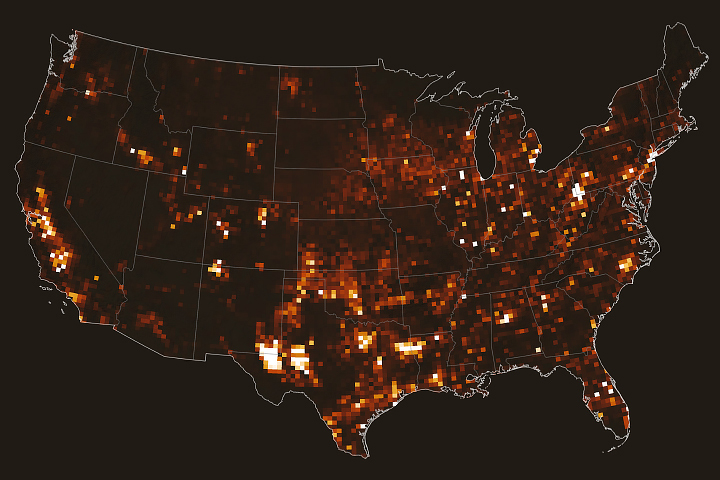
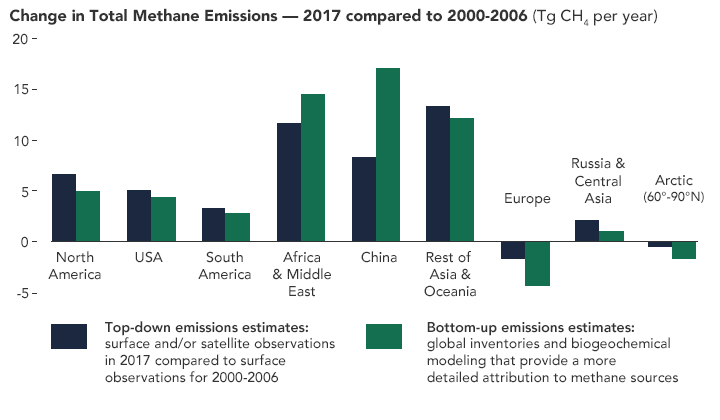
The figure above shows the changes in methane emissions from 2017 compared to the 2000–2006 average and sorted by region. Estimates were compiled through “top-down” methods—based on satellite and ground-based observations—and “bottom-up” methods—summing up all individual sources from global inventories and models. The two independent approaches are used and compared to one another as a way to see how well the methane budget is understood. In both cases, increases in methane emissions over the past two decades were widespread and statistically significant.
“The increase was primarily fueled by human activities—especially agriculture and fossil fuels,” explained Benjamin Poulter, a NASA scientist and coordinator of the wetland methane emissions estimates for the Global Carbon Project. “The specific activities that we linked to the biggest increases were raising livestock, coal mining, waste disposal in landfills, and gas and oil production.”
Across the study years, wetlands contributed 30 percent of global methane emissions, with oil, gas, and coal activities accounting for 20 percent. Agriculture, including enteric fermentation and manure management, made up 24 percent of emissions, and landfills comprised 11 percent. Sixty-four percent of emissions came from tropical regions of South America, Asia, and Africa, with temperate regions accounting for 32 percent and the Arctic contributing 4 percent.
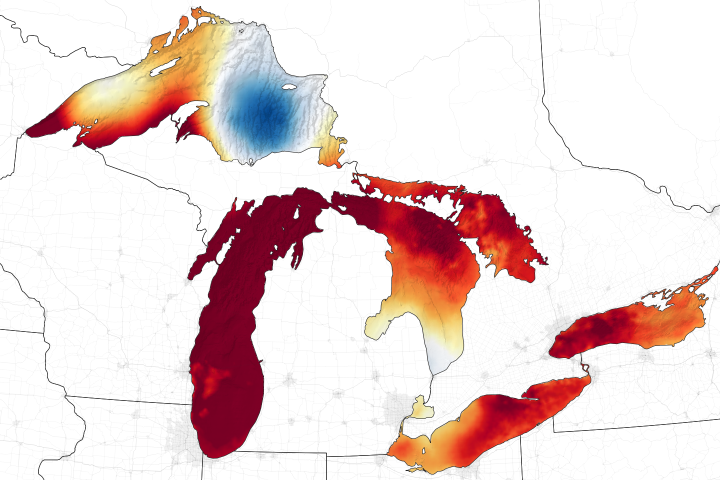
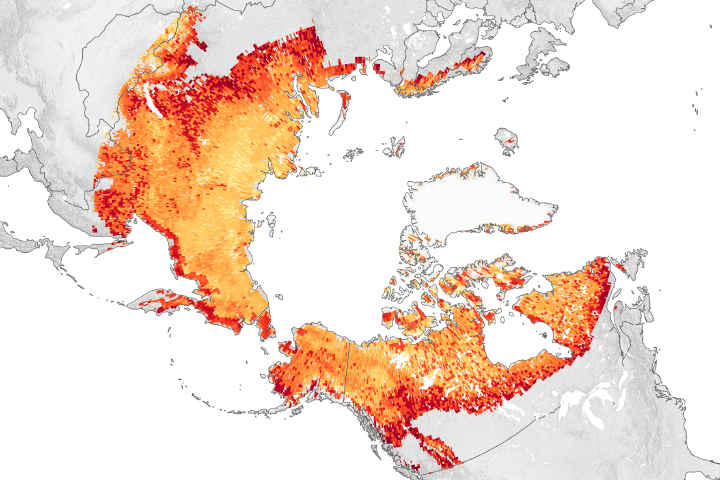
High-latitude ecosystems are particularly vulnerable to climate change. Large amounts of carbon are stored in frozen soils (permafrost) and in forest vegetation in the Arctic. As it thaws, water-logged soil becomes an ideal environment for methane production. “However, we have yet to detect abnormal methane emissions in higher-latitude regions,” said Poulter, “despite thawing permafrost and record-breaking air temperatures year-after-year.”
There is evidence that significant amounts of carbon from thawing permafrost may be entering rivers as dissolved carbon rather than being emitted to the atmosphere as methane. Also, the high-latitude warming may be drying out Arctic ecosystems, causing carbon to leave the soil as carbon dioxide rather than methane.
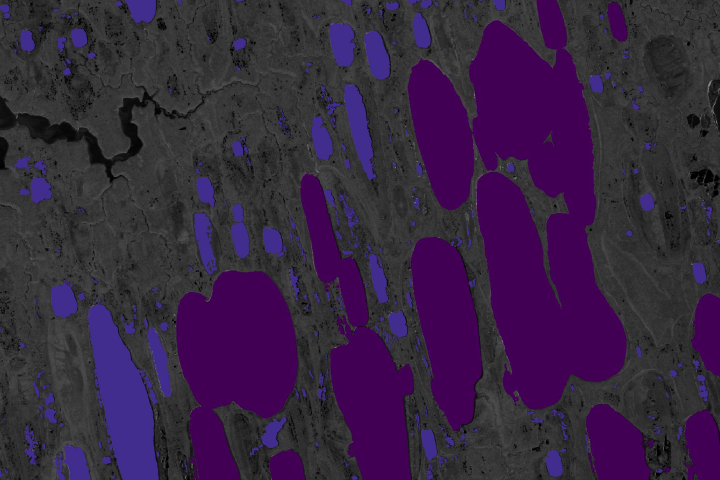
NASA’s Arctic-Boreal Vulnerability Experiment (ABoVE) is one major effort to improve our understanding of how climate change is affecting Arctic methane emissions. For instance, ABoVE researchers recently made hyperspectral airborne observations that confirmed the existence of millions of sources of methane around small ponds and lakes in Alaska and western Canada.
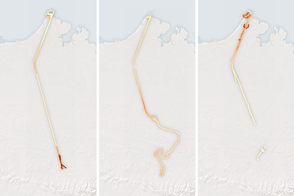
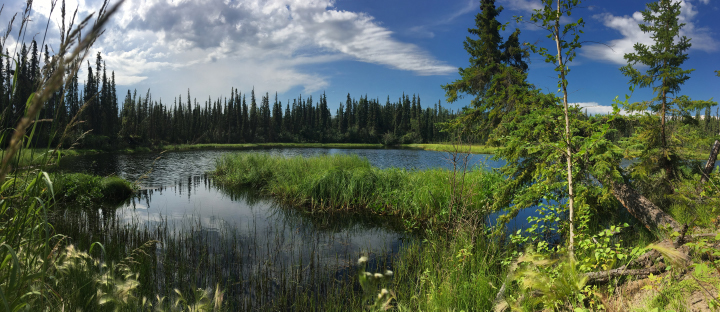
The photograph above shows a freshwater lake in Fairbanks, Alaska, that ABoVE researchers visited in 2016. The lake showed signs of thawing permafrost below the surface, including “drunken trees” that had tipped over as the soil shifted around their roots.
The video above is a data visualization that highlights several different sources of methane emissions produced around the globe and throughout the year. It was created using output from a modeling system developed and maintained by NASA’s Global Modeling and Assimilation Office. Note that the height of Earth’s atmosphere and topography have been vertically exaggerated approximately 50 times higher than normal in order to show the complexity of the atmospheric flow.
NASA Earth Observatory image by Lauren Dauphin, using data from Jackson, R. et al. (2020). Photograph courtesy of NASA/Kate Ramsayer. Animation courtesy of the NASA Scientific Visualization Studio. Story by Adam Voiland.