A team of researchers from the U.S., Europe, and Russia set out to use satellite data and computer models to figure out where moose live in Russia and why they should be more and less abundant in different regions. In theory, more abundant and seasonally consistent vegetation (food) should mean more moose, but they wanted to know whether vegetation health was the best predictor. Such models can be useful for managing animal species and conserving forests and other lands.
The model worked quite well for the early years that the researchers studied. But then something happened: the model was predicting more moose in some areas than the real world delivered. What was happening on the ground that the researchers could not see?
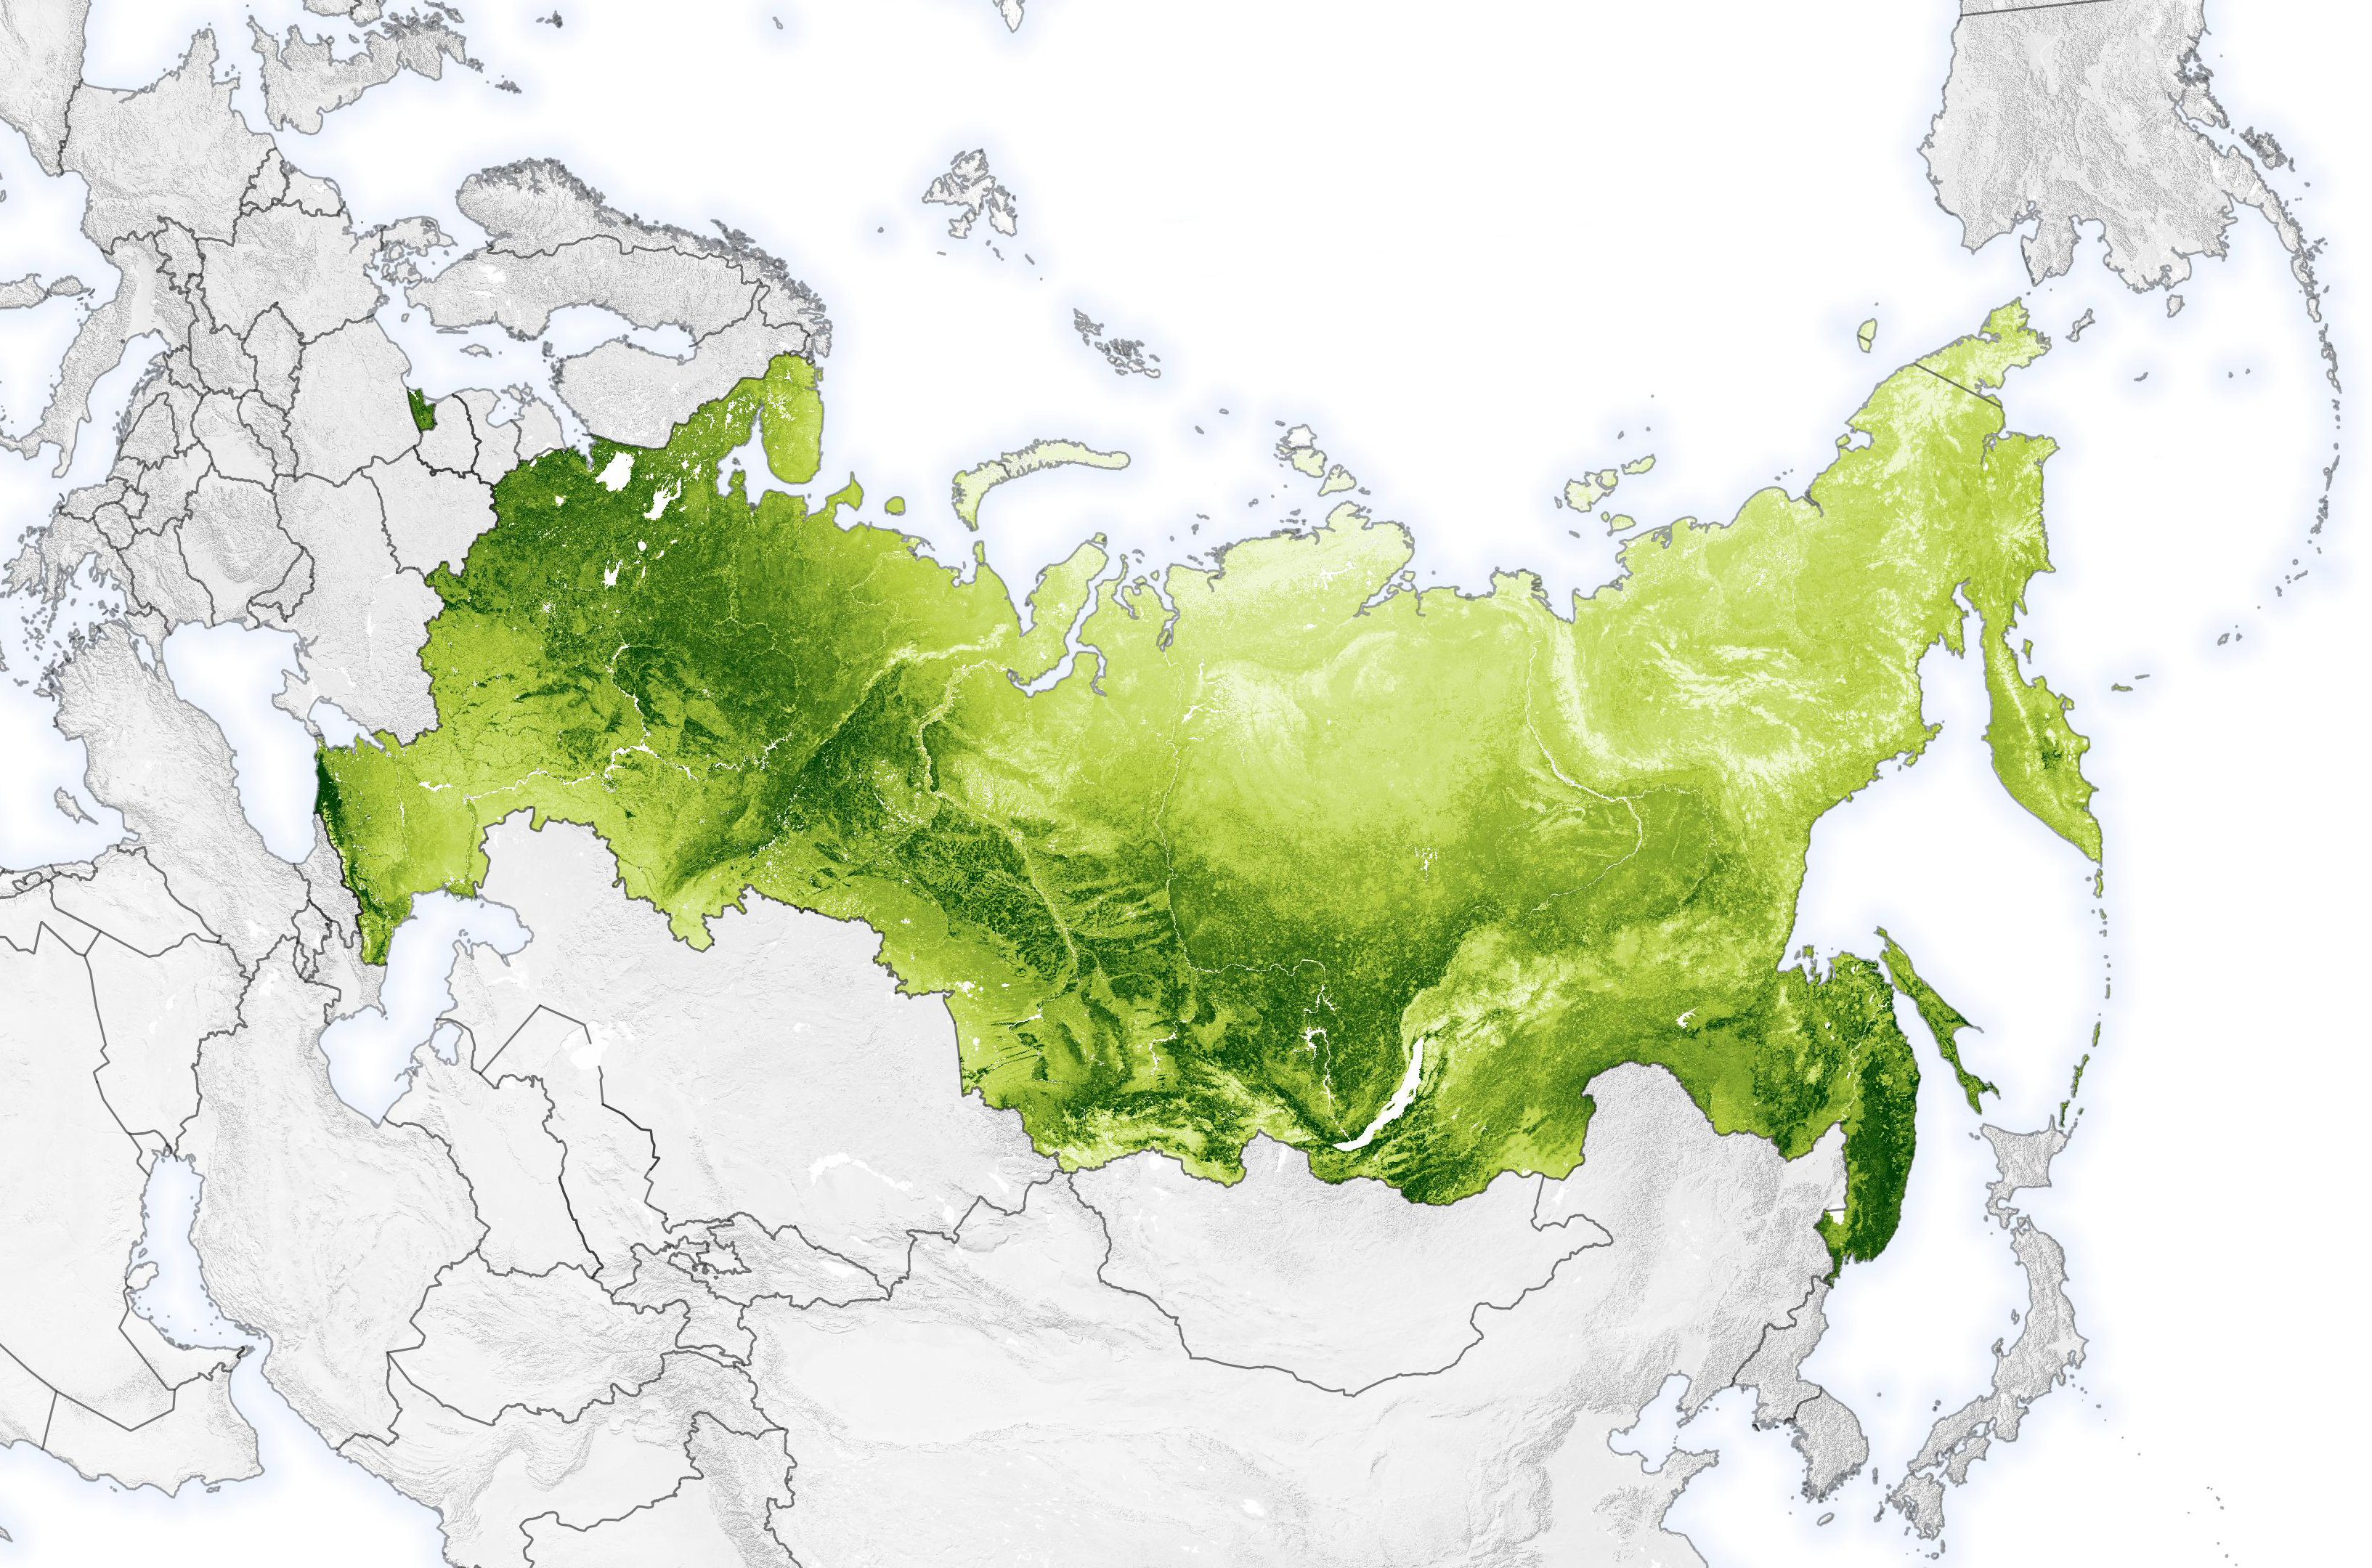
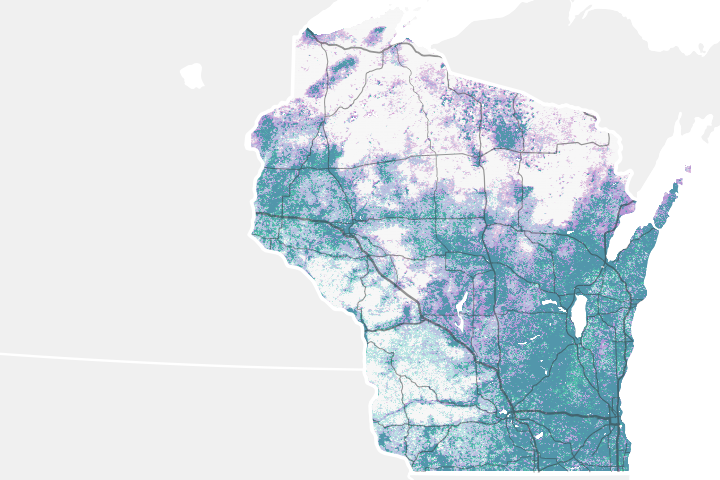
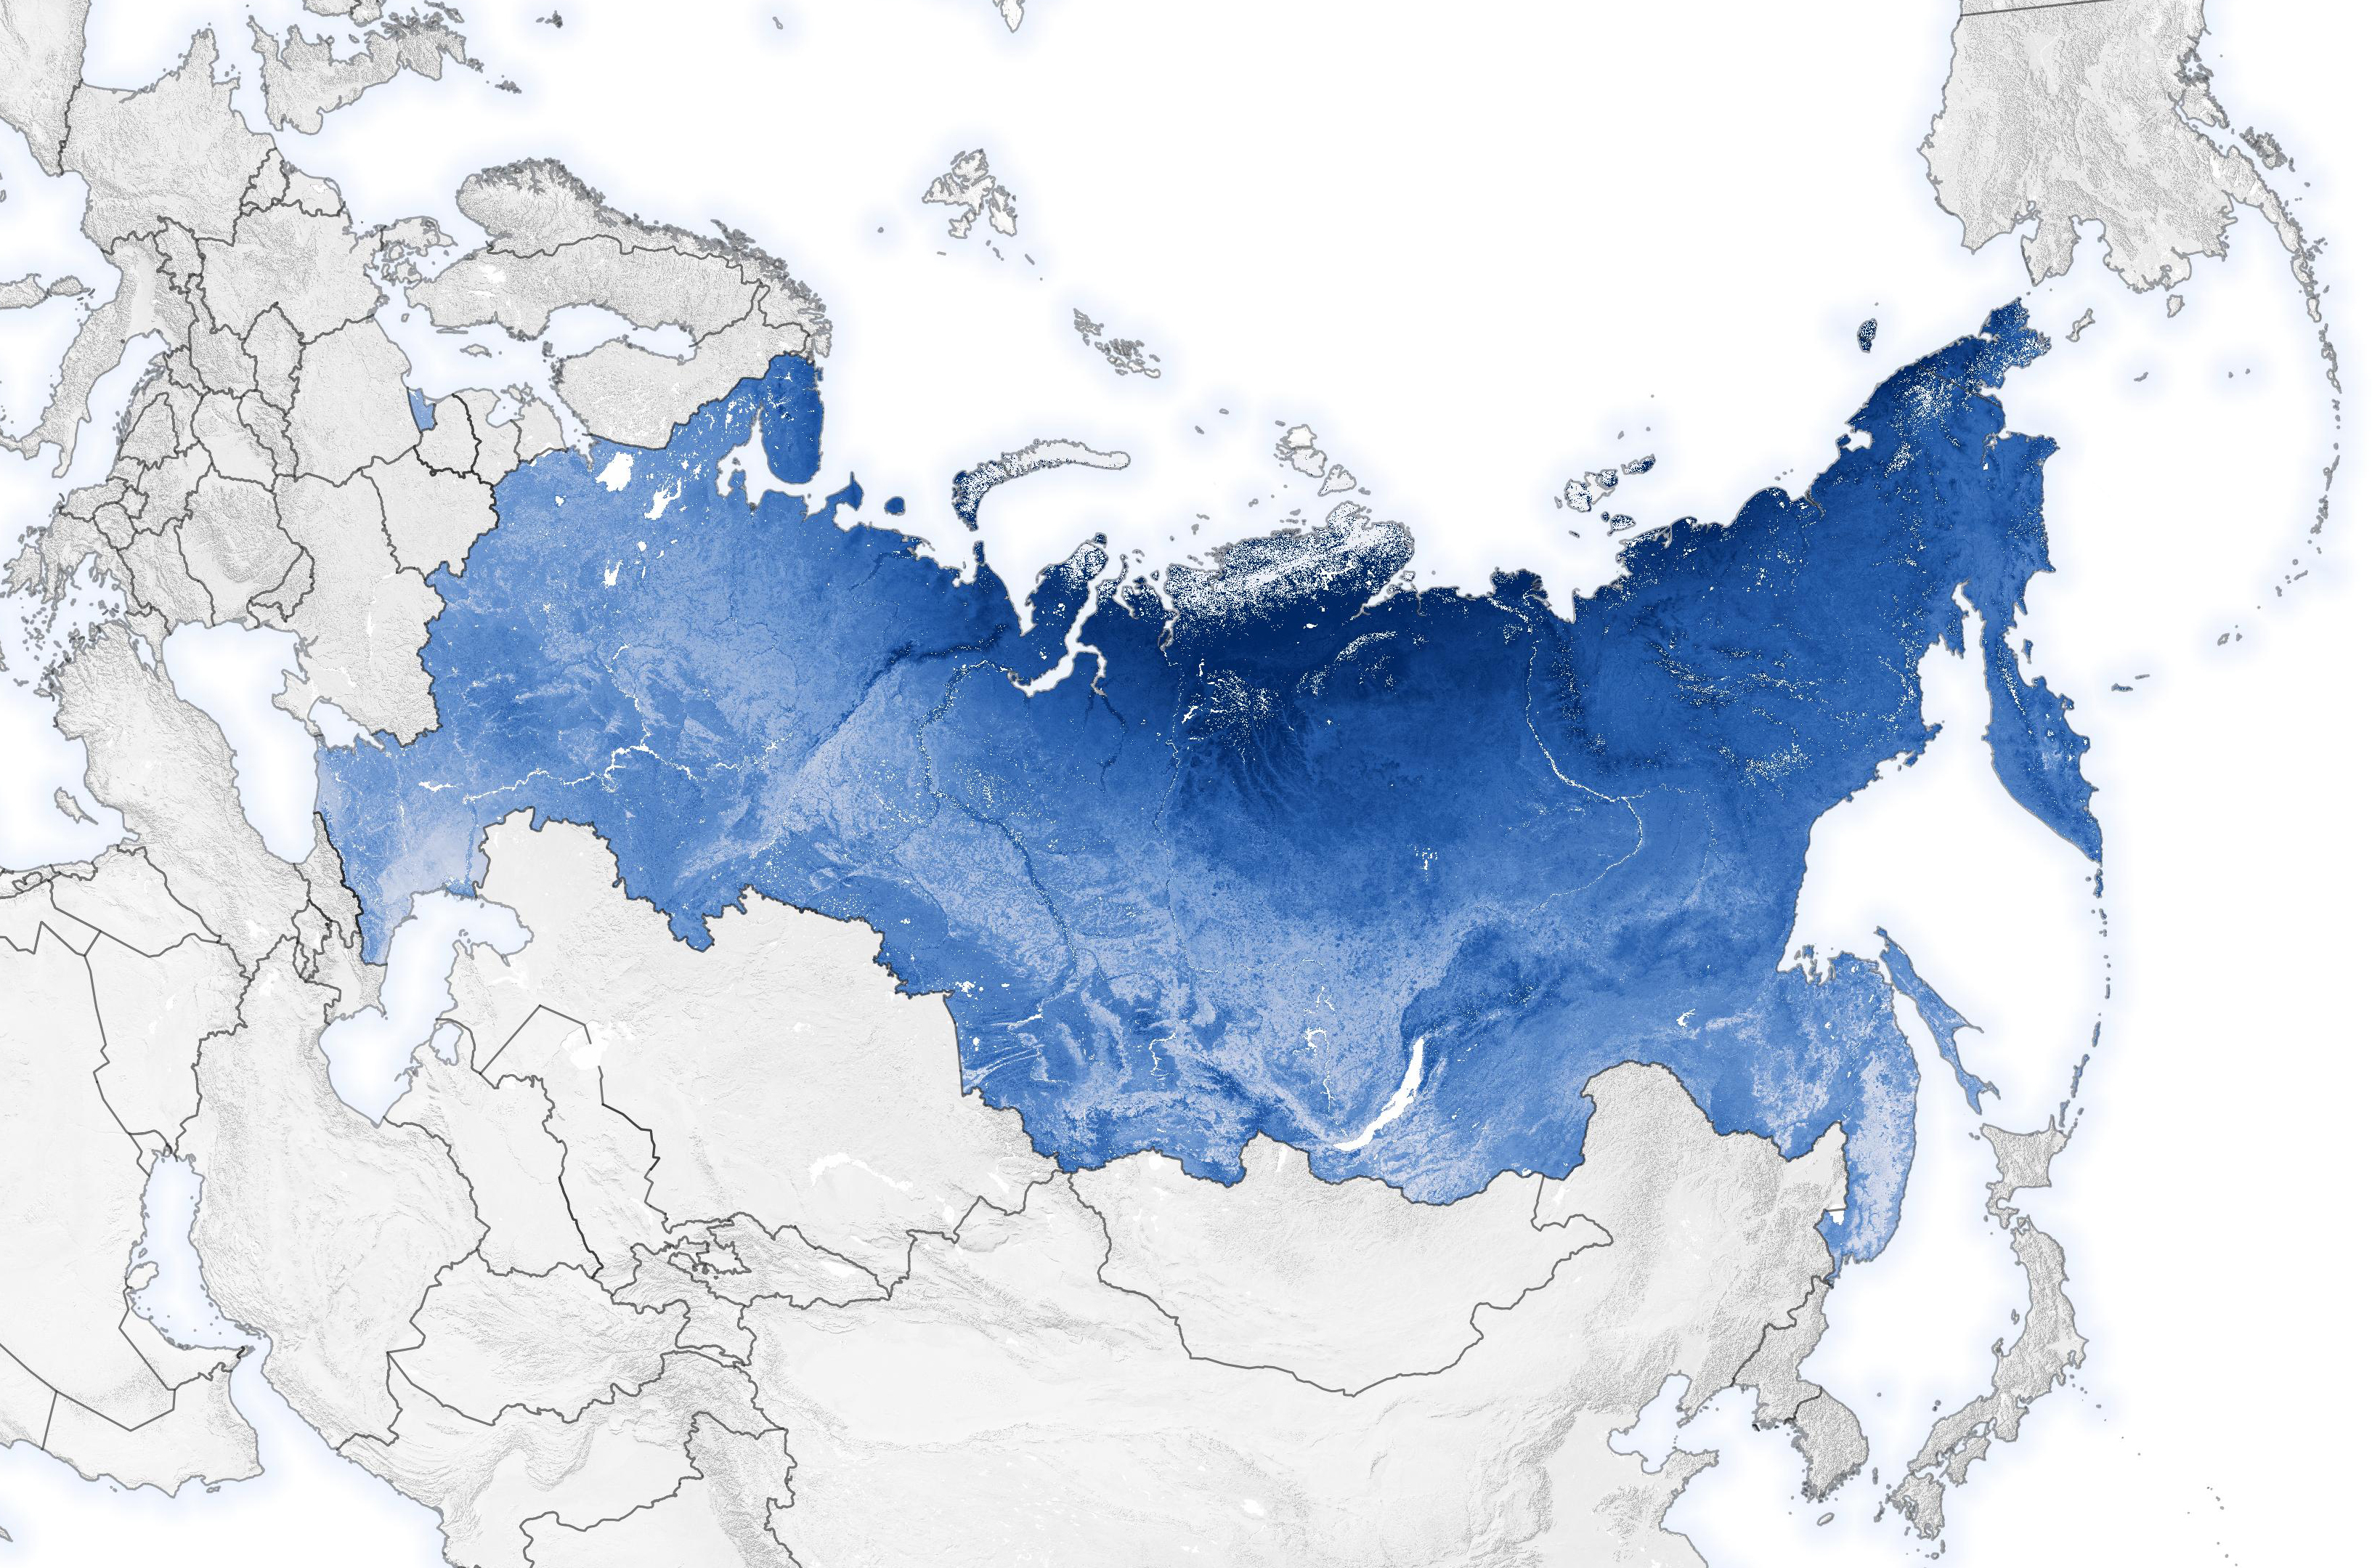
For several years, scientists from the University of Wisconsin-Madison have been developing global Dynamic Habitat Indices (DHIs)—analytical tools to describe the productivity of plants and trees on a landscape and how that influences the biodiversity of animals. The first DHI, cumulative vegetative productivity, measures how prolific and healthy vegetation is across a period of time. Minimum vegetative productivity describes the lowest productivity level. And seasonal vegetative productivity describes how much or little that plant abundance varies with the seasons. The three indices are derived from data collected by the Moderate Resolution Imaging Spectroradiometer (MODIS) instruments on NASA's Terra and Aqua satellites.
The maps at the top of this page show two of the three indices—cumulative and seasonal vegetative productivity—averaged from 2003-2014 across Russia.
In a new study, a team of researchers tried to evaluate how well DHI could predict the density of the moose population across the full range of its habitat in Russia from 1981 to 2010. They also examined variables such as temperature, precipitation, elevation, and proximity to human settlements. And the scientists looked for moose population changes that occurred around the fall of the Soviet Union in 1991 and the subsequent rise of the Russian Federation. The scientists described the moose project in the journal Nature Scientific Reports.
“Explaining animal abundance is complex because it requires an understanding of an animal's environment over long periods of time and over large regions,” said Elena Razenkova, a doctoral candidate at the University of Wisconsin and the lead author of the study. “Our work has shown that by using satellite observations, we can help explain some patterns in moose abundance.”
Across all three decades of the study, DHI and other environment variables, namely annual mean temperature, explained most of the moose population variability in Russia. As expected, moose populations were highest in European Russia (west of the Ural Mountains). Populations were generally two to three times lower in the Asian part of Russia, much of which is taiga and tundra.
Since moose like early successional vegetation—such as small, young trees or new growth in clear-cut or burned areas—it makes sense that they should prosper in places where plants actively photosynthesize and grow for most of the year. The DHI model performed best—meaning moose populations were most tightly tied to vegetation productivity—during the 1980s.
In the second two decades, however, the model became less accurate, suggesting that availability of plant forage was not the only factor limiting moose abundance. Razenkova and colleagues started to suspect that overhunting of moose—a variable that is not really accounted for by the model—could be the best explanation for the discrepancies.
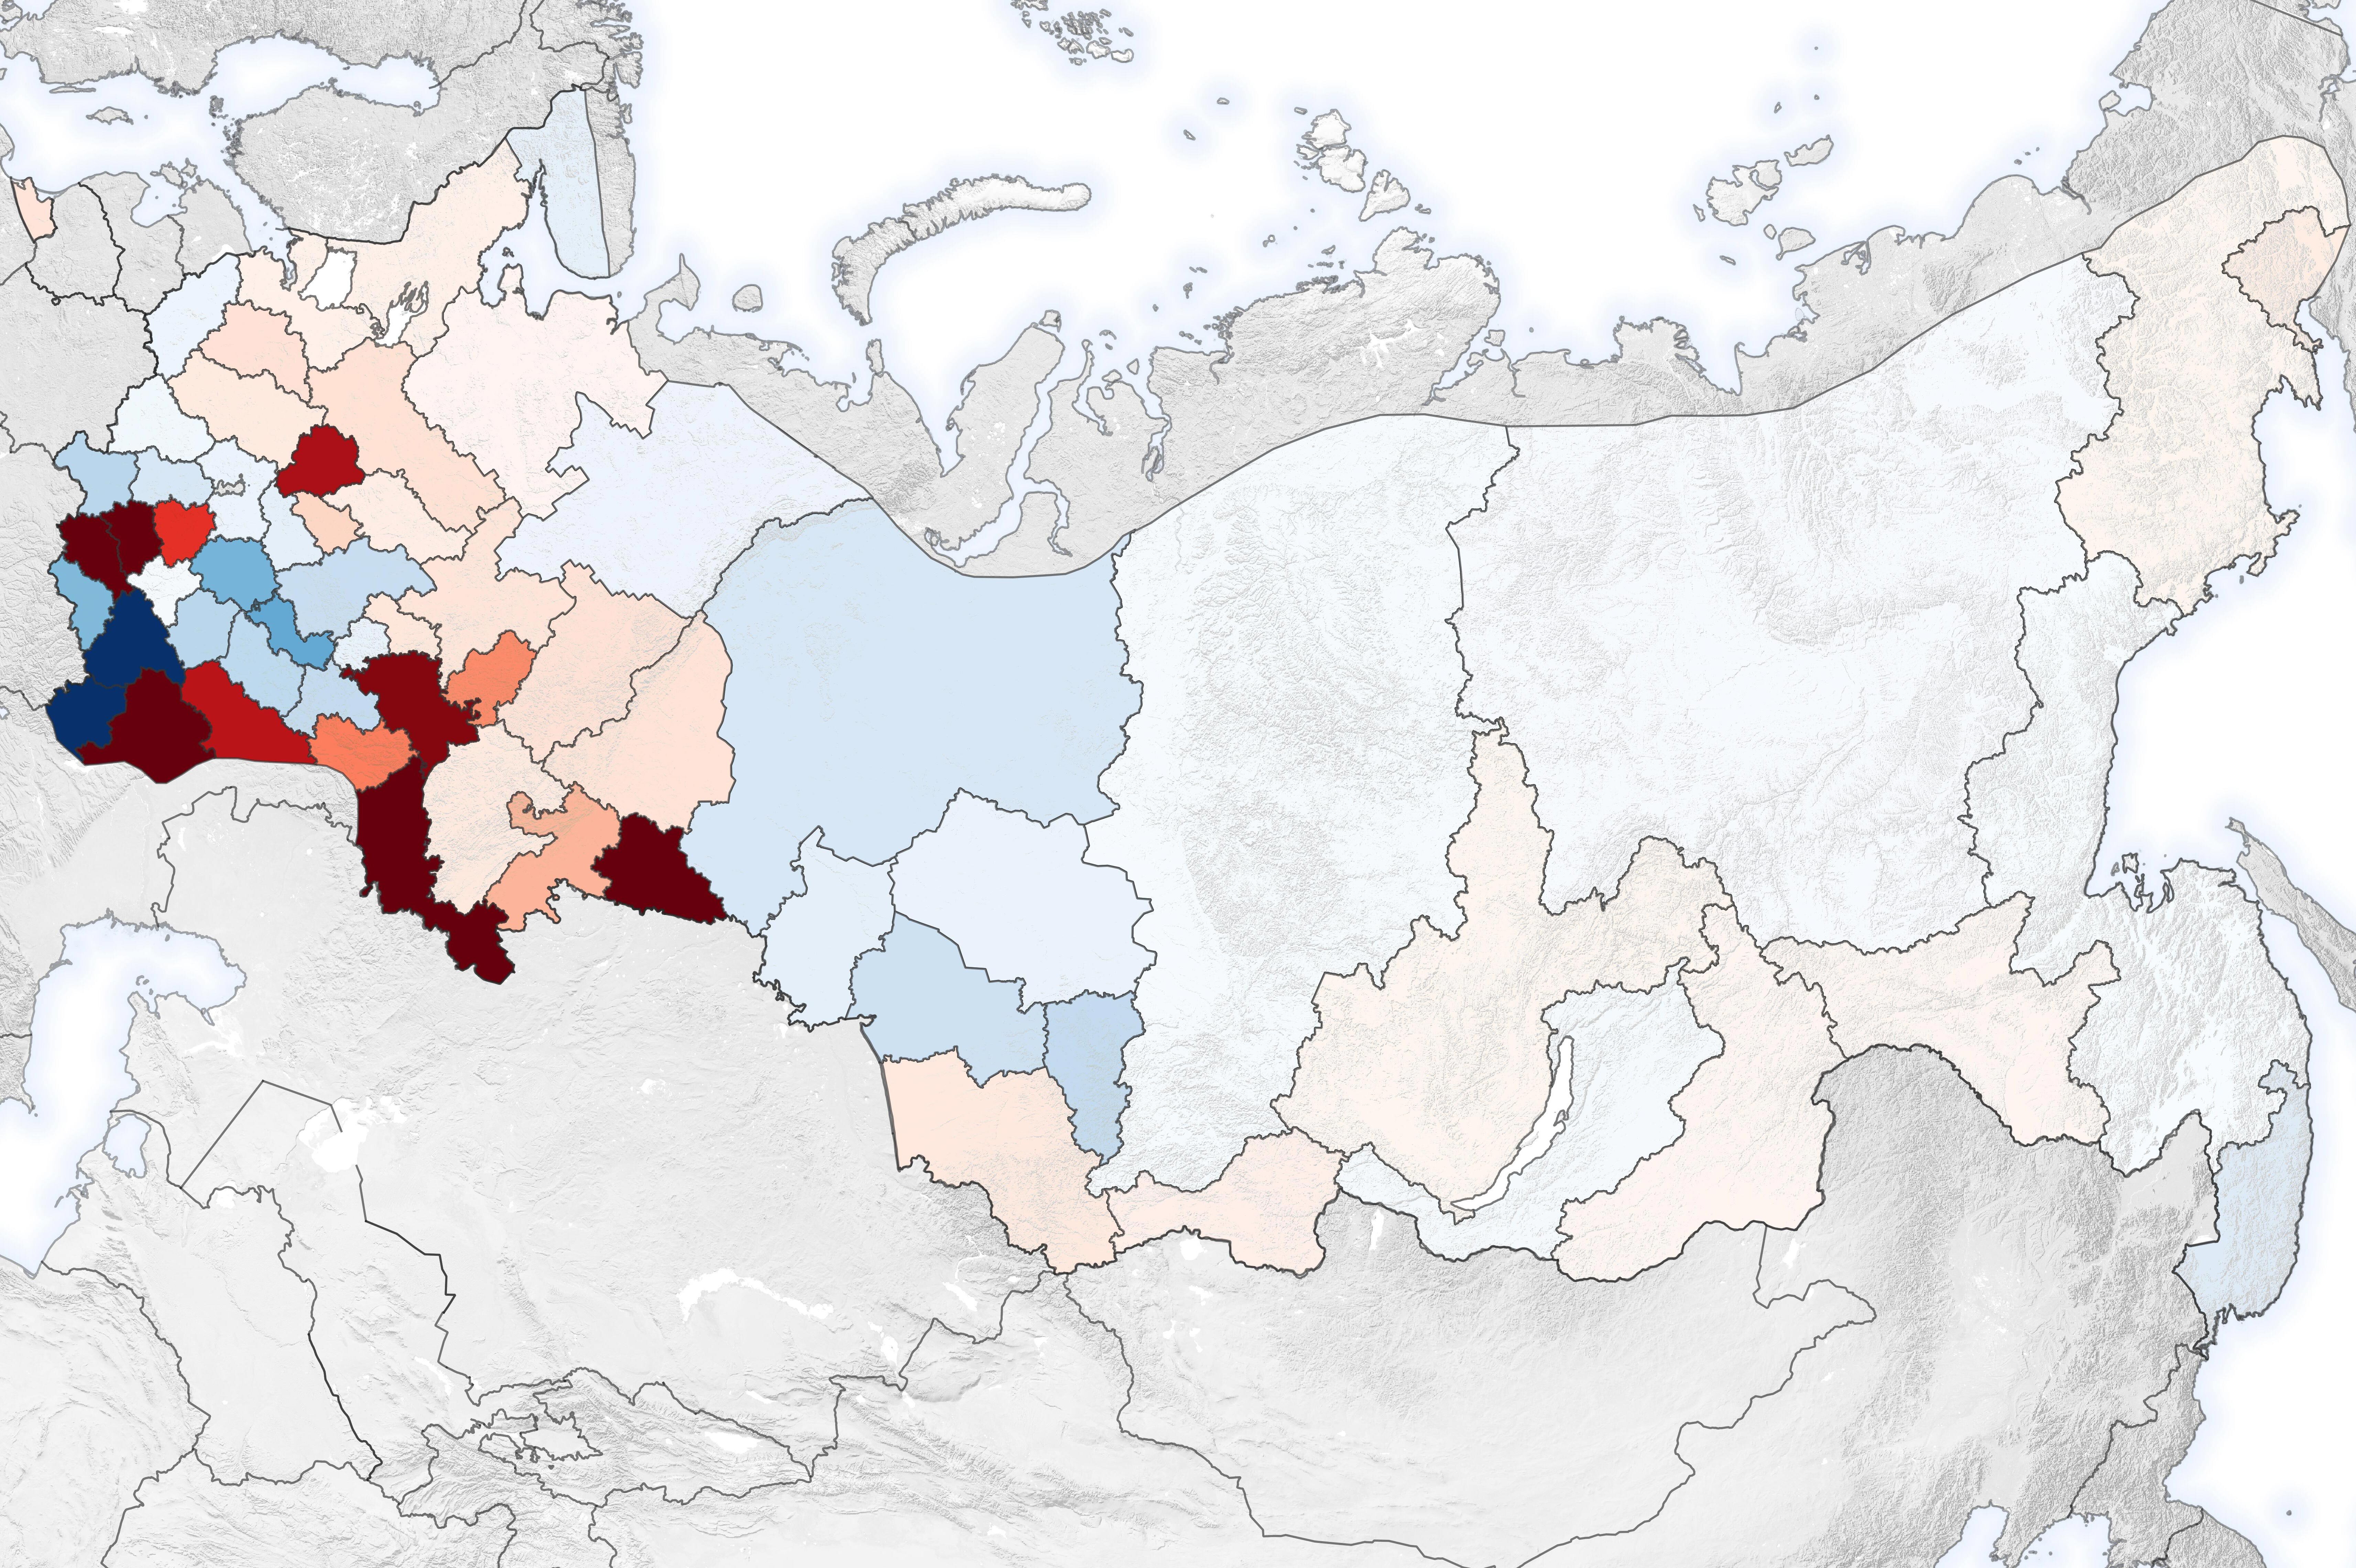
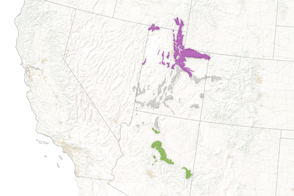
The map above highlights the differences between the model's estimated moose populations compared to counted moose populations. The counted data is derived from the Russian Federal Agency of Game Animals, which estimates populations based on animal tracks in fixed locations, aerial surveys, and hunter surveys. Red shows areas where the model over-estimated moose populations whereas blue shows areas show where the model under-estimated populations.
Previous research has shown that several animal populations declined substantially when the Soviet Union collapsed in the early 1990s and slowly evolved into the Russian Federation. In those years, the country faced a major economic shock and an increase in poverty. More people turned to hunting for food, and moose were on the menu. Additionally, environmental regulation and monitoring fell off as the government coped with other concerns.
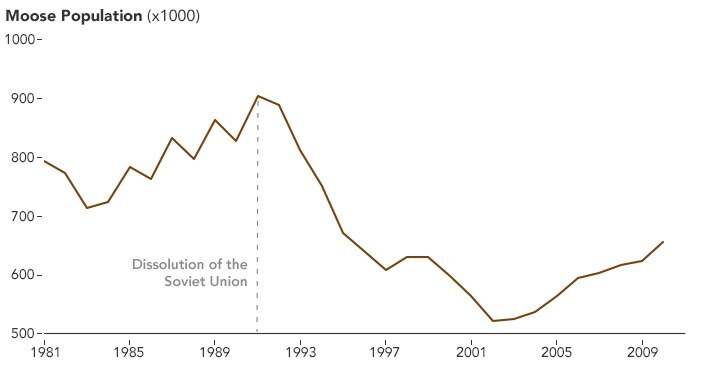
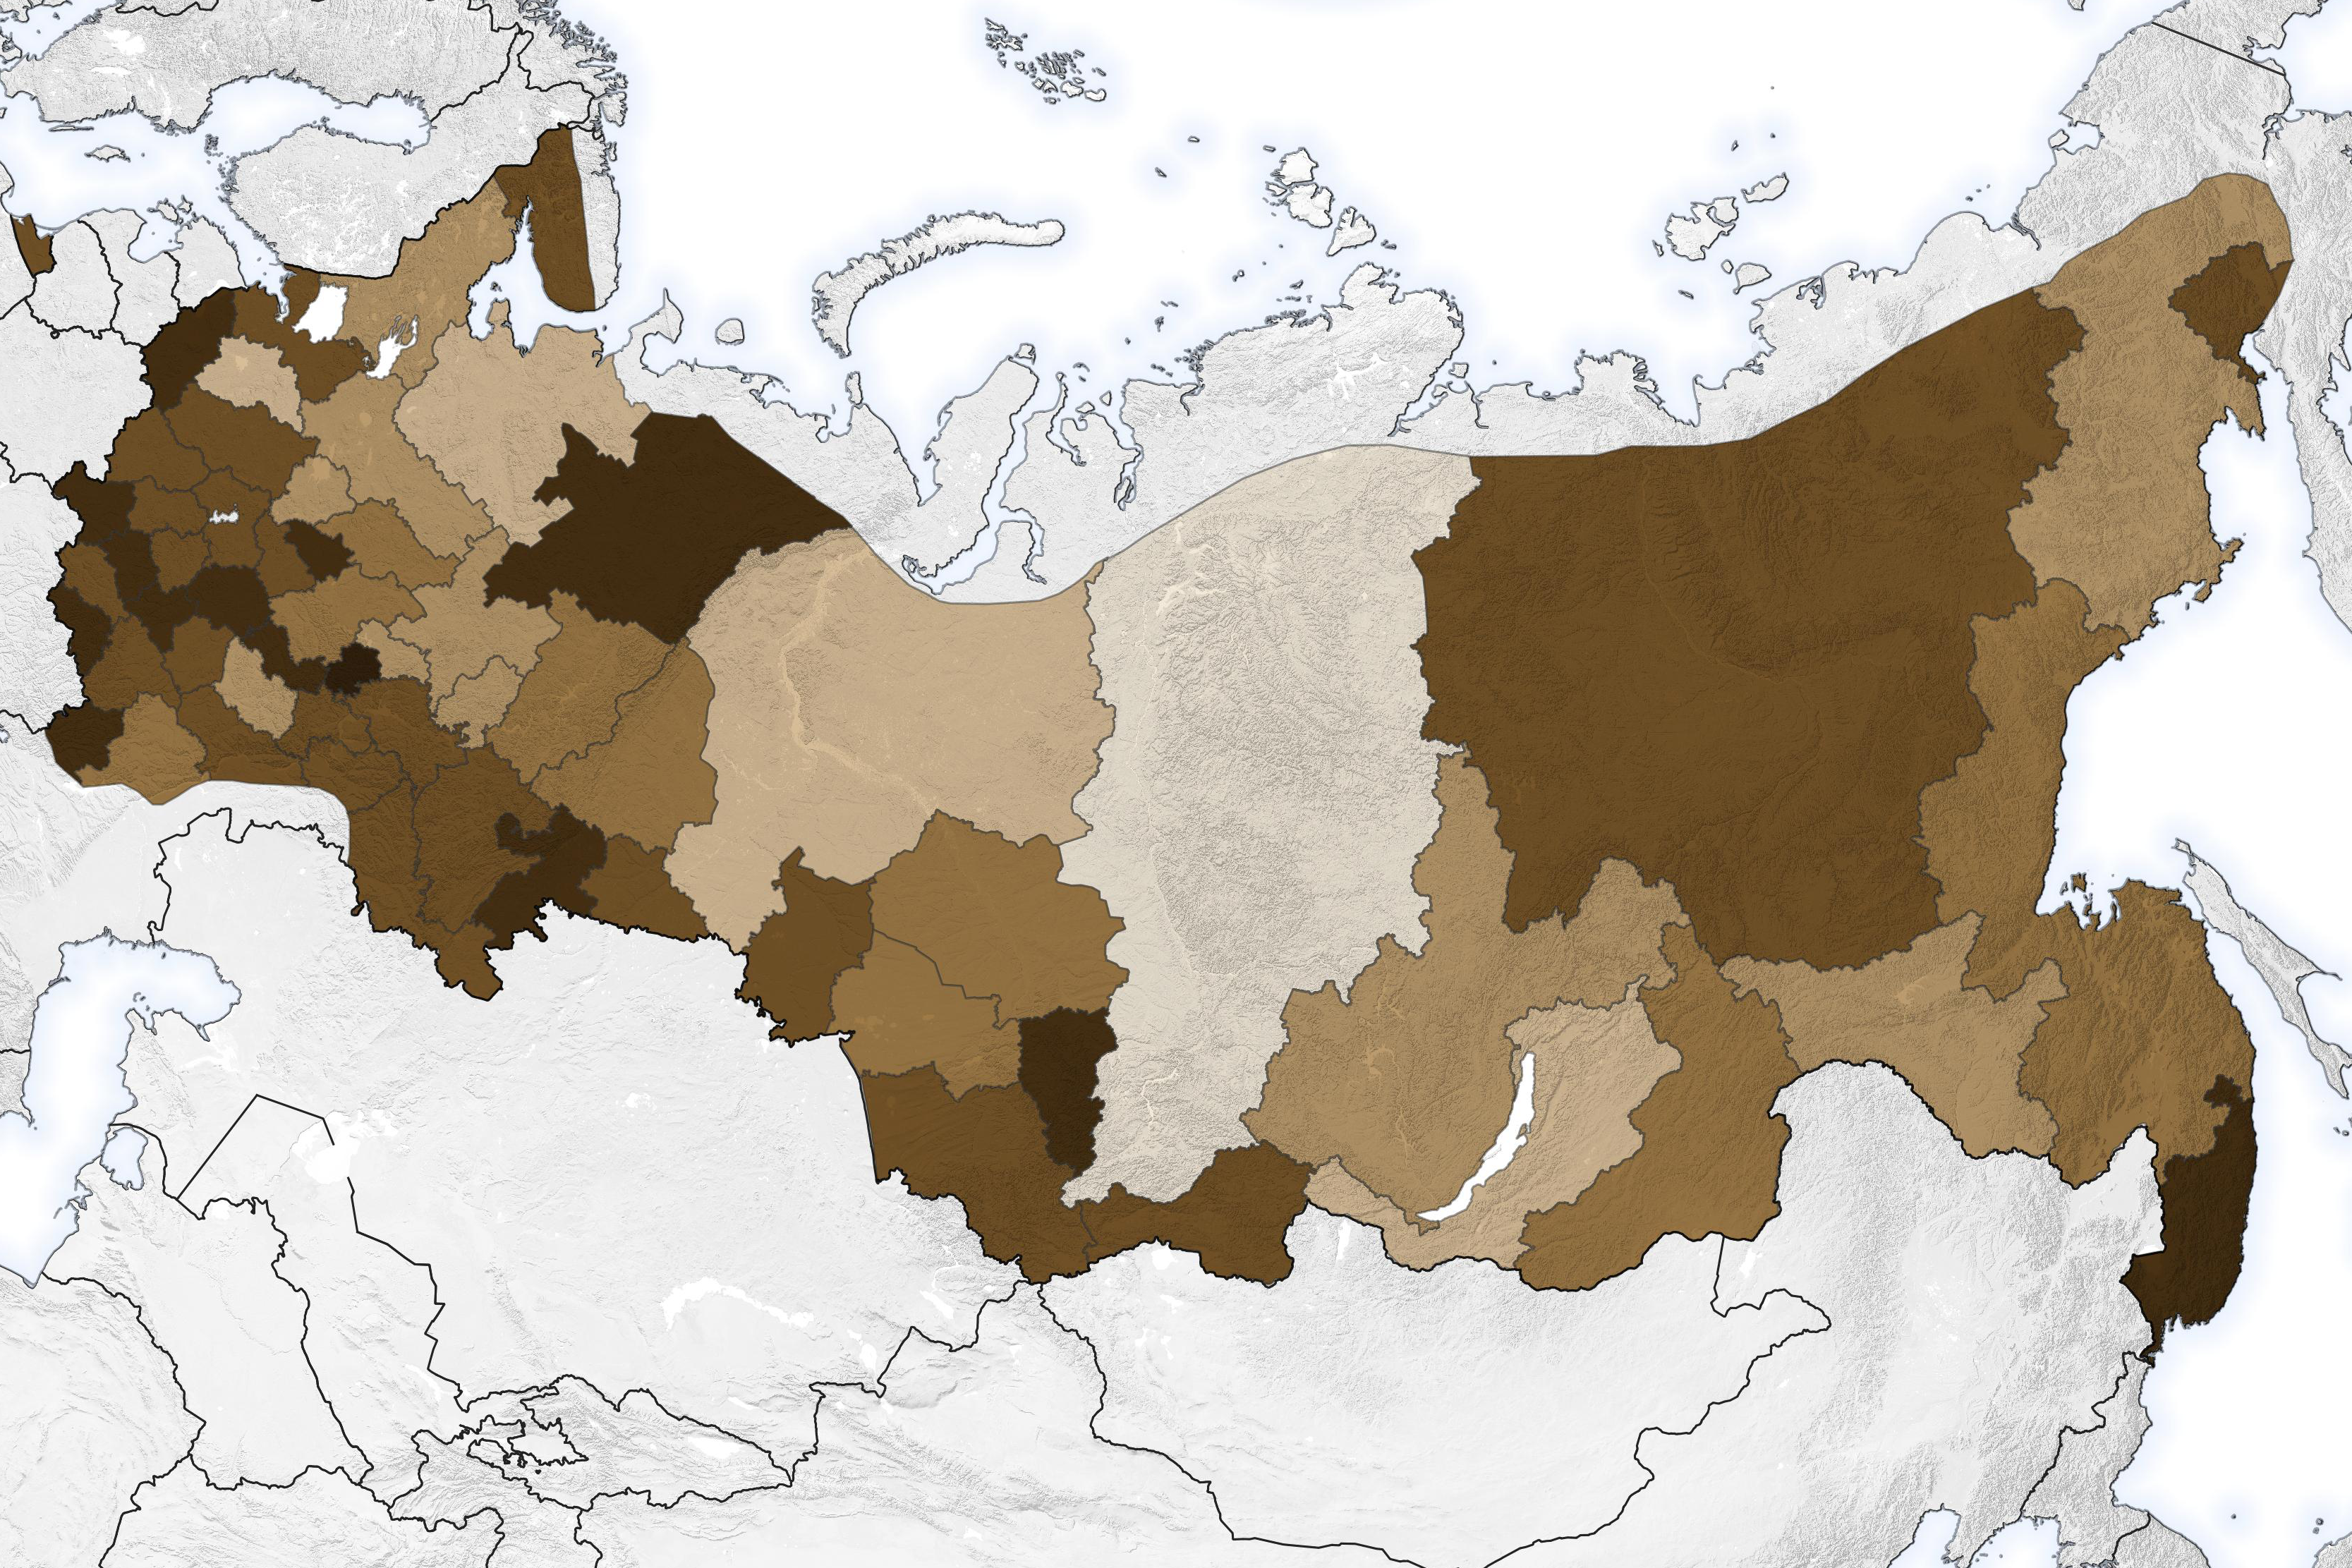
The chart above shows the total moose population across the country from 1981-2010, using data from the Russian Federal Agency of Game Animals. The map below shows geographic changes in moose populations for the same time period.
“At the time, life was changing so quickly, and we were in survival mode,” said Razenkova, who grew up in Siberia. “For example, our parents’ salaries dwindled and sometimes they didn’t get paid for months. When your local economy is not doing well, you have to rely on natural resources.”
By 2002, moose populations began slowly climbing again. “It is hard to identify reasons behind this rise. It could be a data quality decline, renewed enforcement of environmental regulations, or the transformation of abandoned farms into forested areas,” said Eugenia Bragina, a co-author on the paper and researcher at the Wildlife Conservation Society. With Russia’s economy growing again in the 2000s, fewer people had to rely on hunting. Nonetheless, the moose population is still down by one third from its recorded peak in the early 1990s.
“Every biological species is affected by multiple drivers: climate, vegetation, interactions between the species, legal and illegal hunting pressure, and predation,” said Razenkova, who is using this lesson to model other animal populations in Russia. “Even so, we’re able to explain large parts of the variability in moose populations, so we can use the same approach to explain population densities in other mammals.”
NASA Earth Observatory images by Lauren Dauphin, using data from Razenkova, Elena, et al. (2020). Story by Kasha Patel and Michael Carlowicz.
alert message


