It is one of the most productive patches of water on the planet. It was also the location for our first-ever Image of the Day.
In the South Atlantic Ocean, off the coast of Argentina, Uruguay, and Brazil, warm currents from tropical waters flow south and run into cooler currents flowing north from the Southern Ocean. They meet in a place known as the Brazil-Malvinas Confluence. At least seven different water masses of varying temperature, depth, and salinity arrive at this turbulent, three-dimensional intersection, leading to vertical and horizontal mixing. With all of the churning—plus nutrient-rich outflows from rivers (such as Rio de la Plata) and dust blown out from Patagonia—this patch of ocean is a factory for phytoplankton.
Phytoplankton are plant-like floating organisms that use chlorophyll to harness sunlight and turn it into food. They form the center of the ocean food web, becoming food for everything from microscopic animals (zooplankton) to fish to whales. They are key producers of the oxygen that makes the planet livable, and they are critical to the global carbon cycle, as they absorb carbon dioxide from the atmosphere.
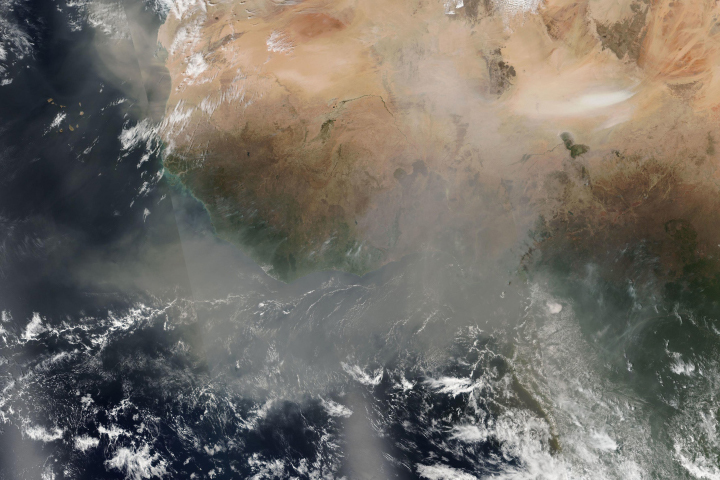
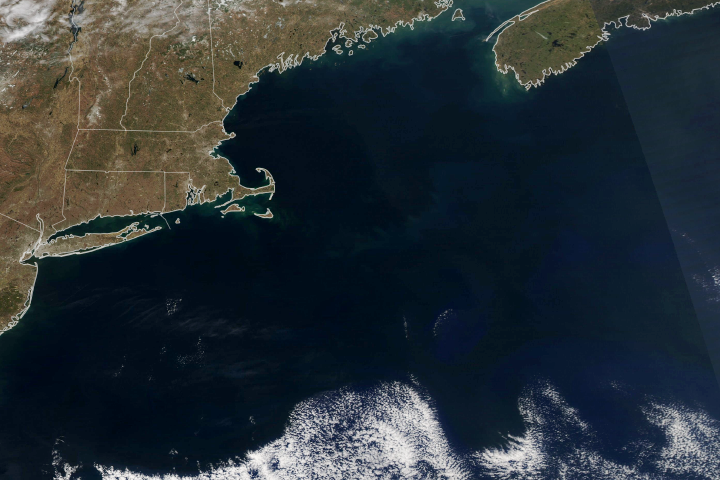
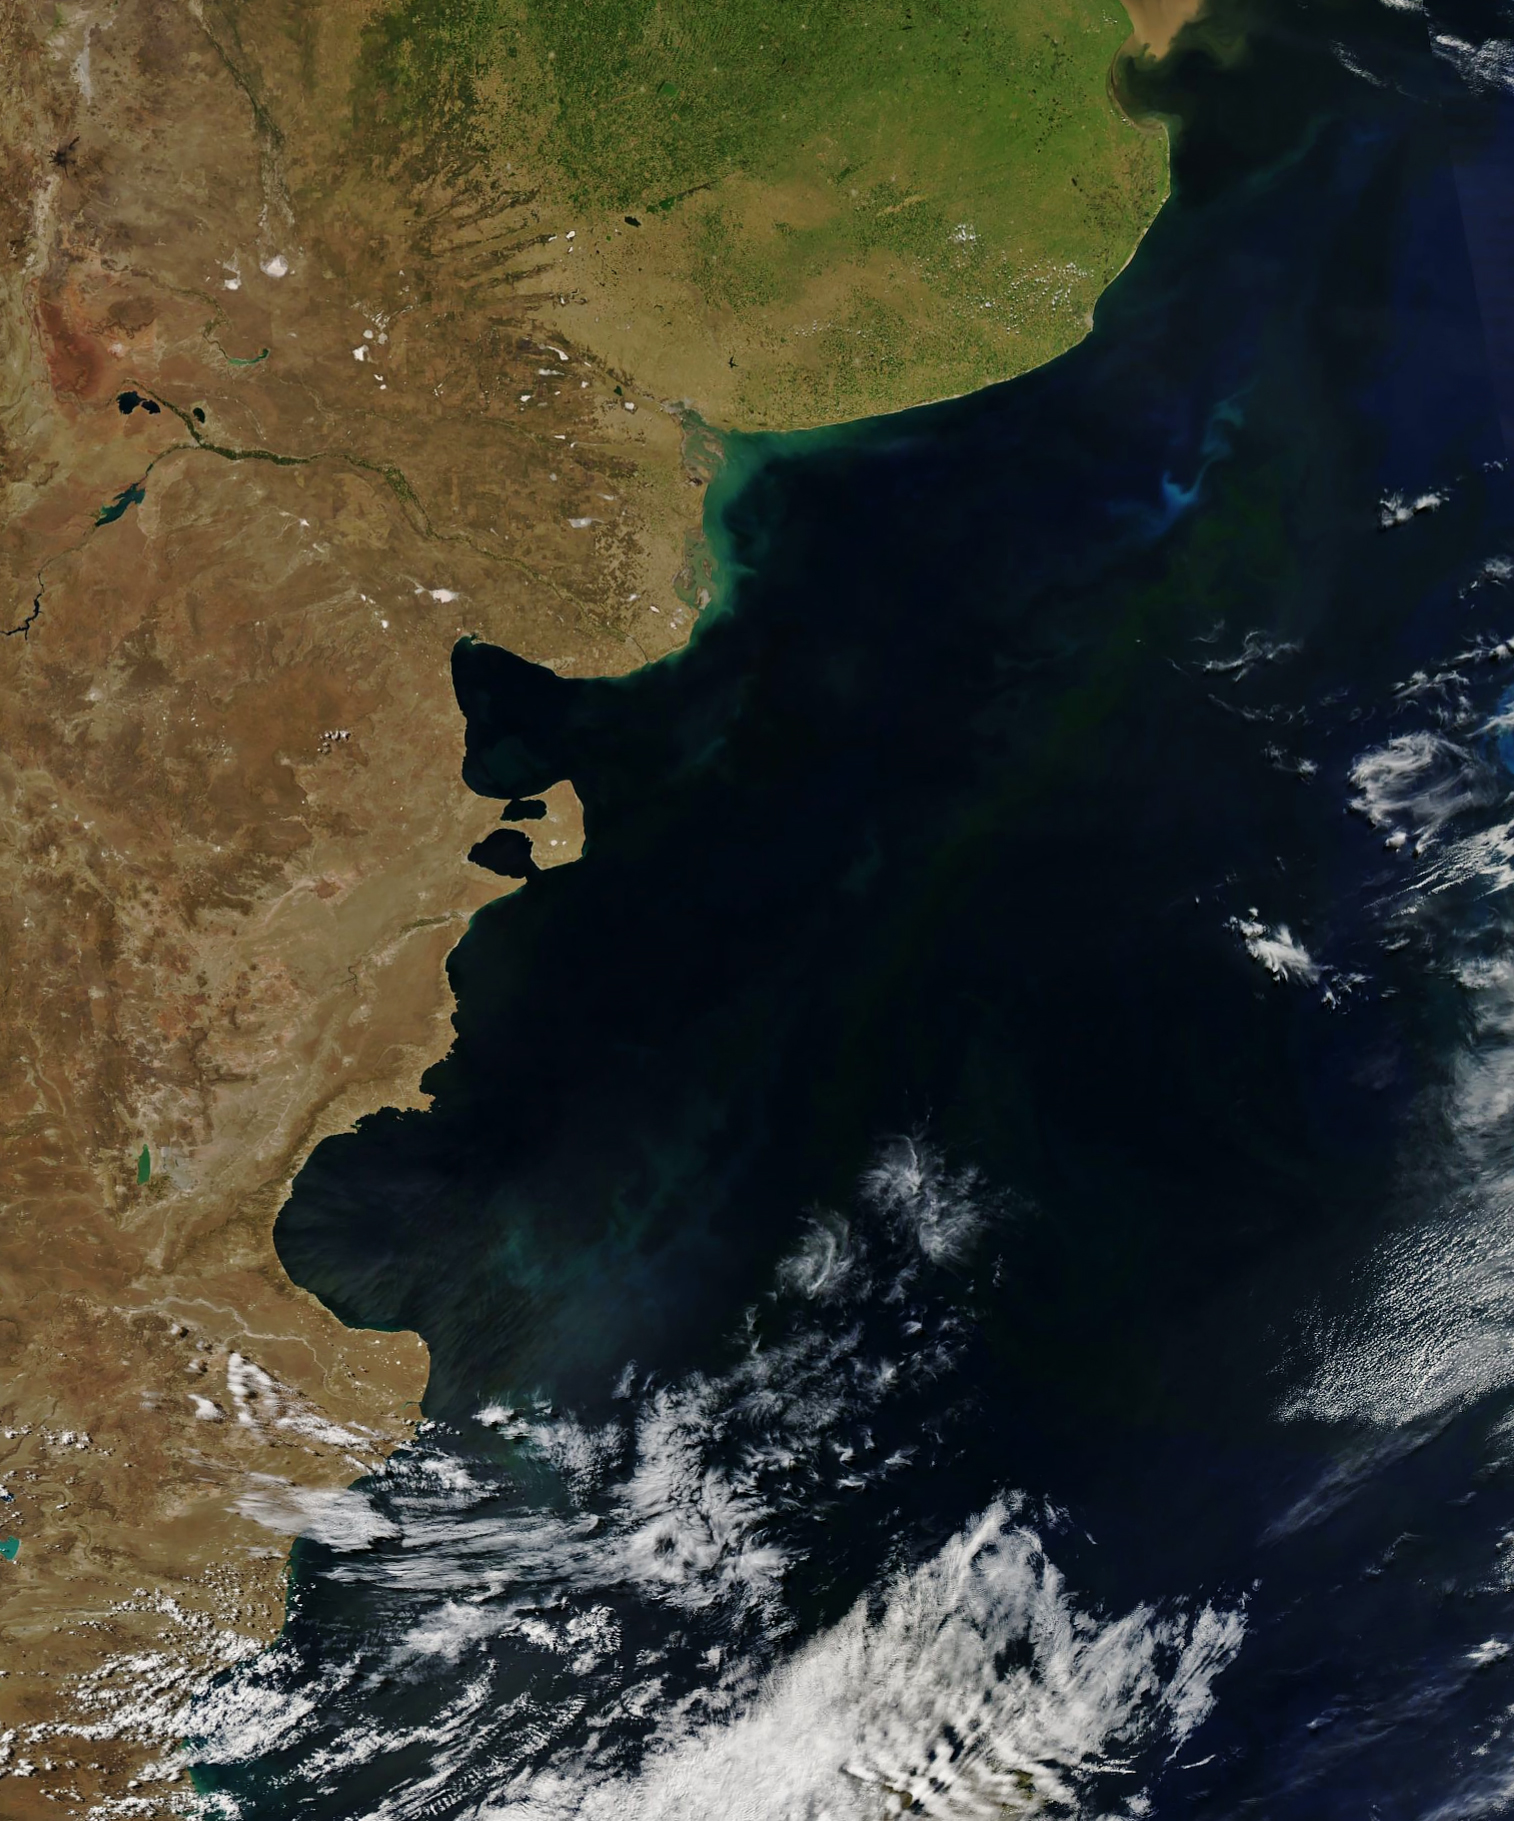
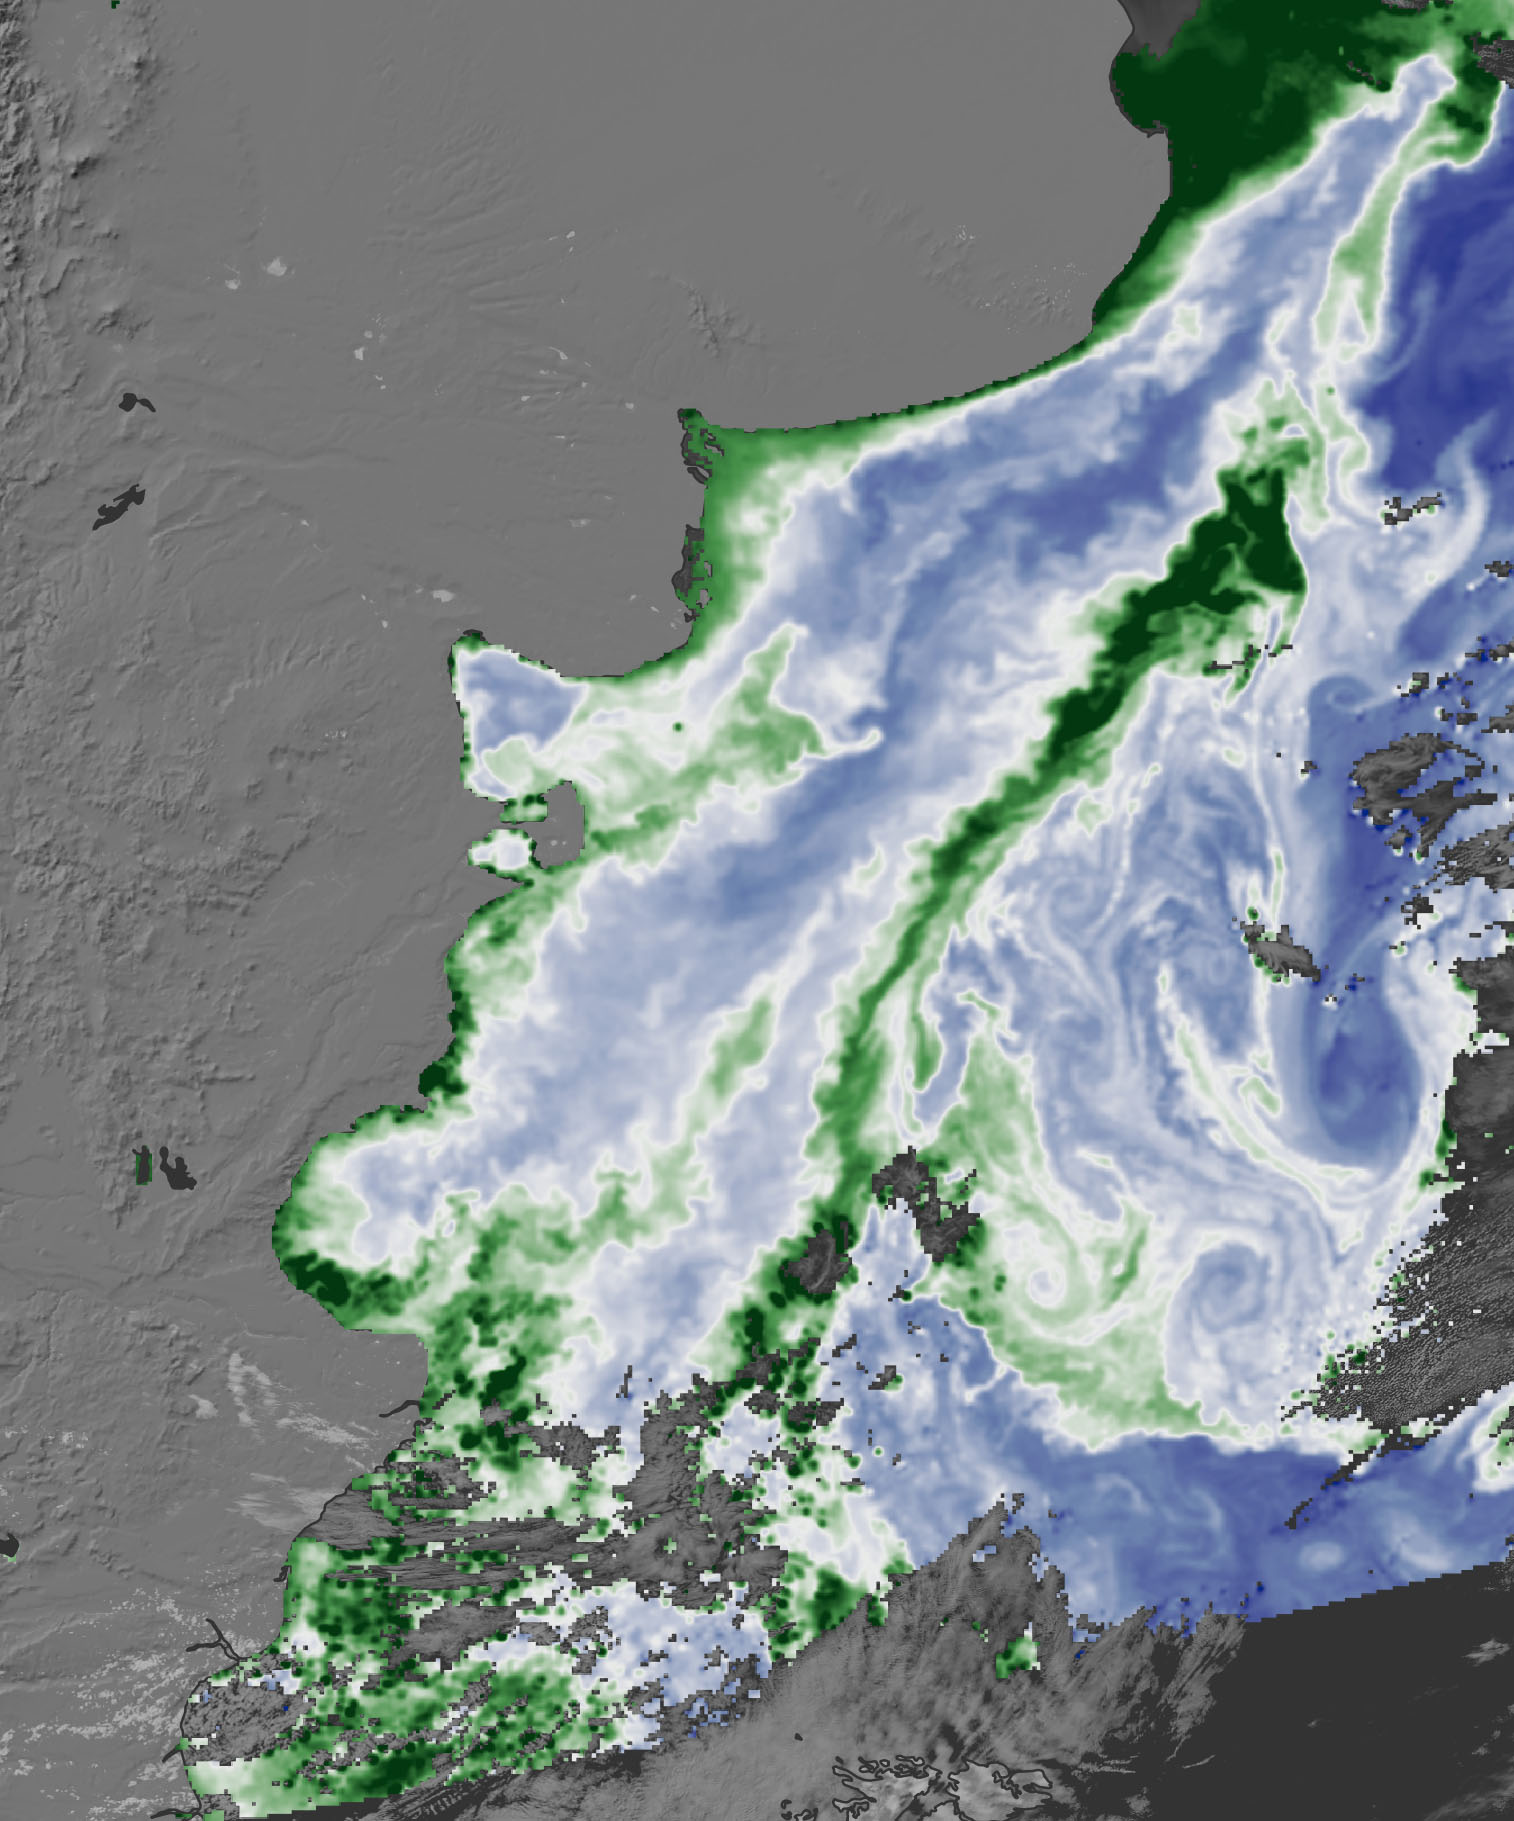
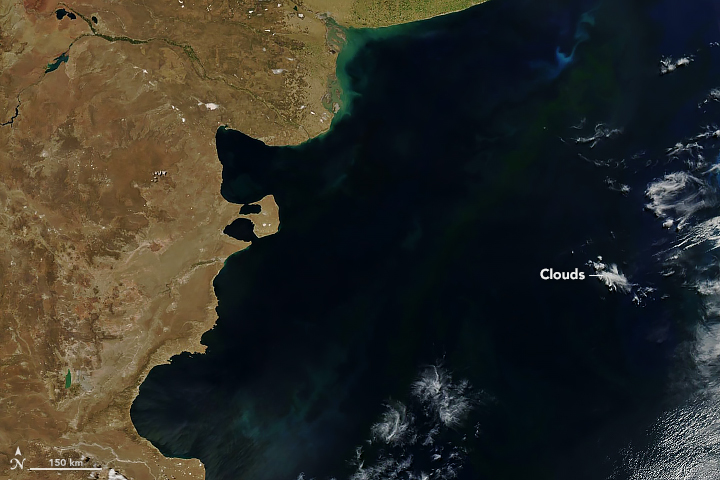
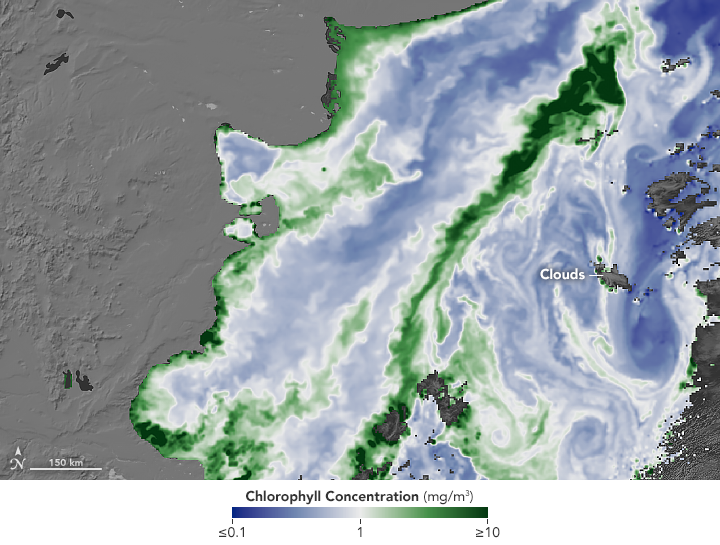
The images above show what a NASA satellite could see in this dynamic patch of ocean on February 15, 2019. The data were acquired by the Moderate Resolution Imaging Spectroradiometer (MODIS) on NASA’s Aqua satellite. In the natural-color image on the left, we see very faint traces of green and milky blue amidst the inky blue-black of the deep ocean. The right image shows concentrations of chlorophyll–a, the primary pigment used by phytoplankton to capture sunlight. The darkest shades of green show areas with the greatest chlorophyll concentrations. MODIS can see what is opaque to our eyes because it detects a range of visible light, infrared, and near-infrared wavelengths, and because scientists have spent decades refining their tools for spotting the chlorophyll signal amidst the noise of the ocean and atmosphere.
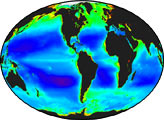
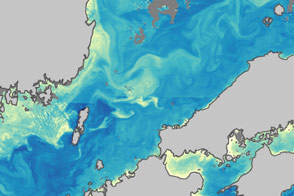
The map below shows chlorophyll in the same area in 1999 as observed by the Sea-viewing Wide Field-of-view Sensor (SeaWiFS). Chlorophyll concentrations are shown on a rainbow palette, with yellows and reds representing the highest concentrations. The map was the first item ever published on NASA Earth Observatory.
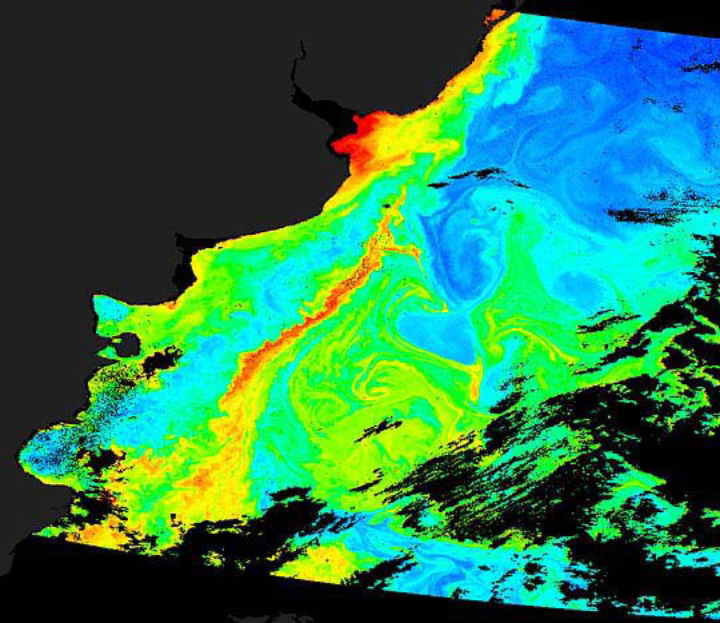
There are similarities and differences. The water was quite productive then as it is now, and it also shows similar swirls and curves where phytoplankton trace the edges of eddies and currents. The details, however, were a bit coarser. SeaWiFS could spot details (image resolution) at a level of four kilometers per pixel; MODIS observes at 1 kilometer per pixel. The colors of the chlorophyll map are also different due to a change in the way Earth Observatory presents data. Just as ocean science has evolved, the study of data mapping and visual communication has taught us to better represent data in ways that are more understandable, more accessible (including the colorblind), and more detailed and nuanced.
The improvements in our ocean vision have as much to do with improving how we see—how scientists apply the corrective lens of experience and better data filtering—as they do with the quality of ocean-observing satellites. “The orbiting ocean-color sensors we use today are not really that different from 20 years ago,” noted Norman Kuring, a NASA ocean color specialist who has been handling such data for three decades. “I think that we are mainly learning gradually about the ecological geography of the ocean through accumulation of data, the pursuit of diverse research projects, and improved atmospheric correction and bio-optical algorithms.”
As NASA Earth Observatory starts its 20th year publishing science stories and imagery, we plan to explore the way the planet and our view of it has changed. This is the first in a year-long series of looks back and forward at Earth system science.
NASA Earth Observatory images by Joshua Stevens and Robert Simmon, using MODIS data from NASA's Ocean Color Web, and SeaWiFS data from NASA/Goddard Space Flight Center. Story by Michael Carlowicz.
alert message