
Refining TRMM’s Picture of Urban Rain | |||
“The pioneering work that Marshall did with the TRMM satellite data to analyze the signature of urban areas started a lot of people thinking of different ways that they can relate space-borne rainfall data to different urban signatures,” says Steve Burian, a hydrologist at the University of Utah. Burian collaborated with Shepherd to refine the picture of urban rain that TRMM had provided. When TRMM detected urban rain over a particular city, could they determine what mechanisms were triggering the rain? The question required both a model and satellite data. With the model, they could map out different scenarios—a sea breeze interacting with the urban heat island, an existing storm being split by the city, and so forth—and see how the rainfall that came out of those scenarios compared with the TRMM data. Shepherd and Burian first tackled Houston, Texas. Along the Texas coast, a sea breeze carries moist air inland in the afternoons, and summer rain forms when the moist air piles up along the curves in the coastline carved out by various inlets. Previous studies had suggested that rain patterns in Houston were related to the shape of nearby Galveston Bay, but Shepherd reasoned that several other segments of the coast had a similar shape and should therefore display similar rainfall patterns. Repeating the gridding approach he used in his first studies, Shepherd broke the Texas coastline into seven chunks and analyzed TRMM rainfall data in each. If the coastal shape caused rainfall, then he should see the same patterns in all of the grids, but if the city of Houston was influencing rain, then there would be more rain in that grid. The grids containing Houston and the region downwind received the heaviest rain. “The sea breeze interacts with the urban circulation to create an anomaly,” concludes Shepherd. In a related study, Burian and Shepherd also used historical rain gauge data to confirm that the percent occurrence of rainfall around Houston had increased in post-urban Houston as compared to pre-urbanized Houston. Burian and Shepherd also revealed that the city of Houston may have shifted the time of likely occurrence of storms until later in the afternoon. |
|||
 |

The next step was to put these results into a model to see if they could duplicate the exact processes that created the urban rain effect and determine how much the city had influenced recorded rainfall. In the case of Houston, was the sea breeze interacting with the urban heat island, aerosols, or the city structures? If the city weren’t there, what would have happened? “We’ve actually done experiments with the model where we’ve taken the city [Houston] out and tend not to get rainfall on a specific day. The city creates rainfall that wouldn’t have even been there had the city not been in place,” says Shepherd. When Shepherd and Burian ran the model with the current Houston “cityscape,” they found that the sea breeze was split either by Houston’s buildings or by the pool of hot air over the city. “It’s like a pebble in a stream: the water flows around the pebble and converges on the other side,” says Shepherd. In the model, the onshore breeze encountered the city, split, and flowed back together downwind of the city, creating the convergence that generates storms—exactly where TRMM and rain gauges observed higher rain rates. Shepherd saw a similar pattern over Phoenix, Arizona. When he conducted an analysis of a 108-year rain-gauge dataset of rainfall patterns around Phoenix, Arizona, he found that the urban heat island circulation over the city may interact with air flowing down a nearby mountain to generate extra rain in a suburb northeast of the city. TRMM data also confirmed the presence of this anomaly. So the way a city influences rain may differ depending on its location and what other factors influence weather in the region. |
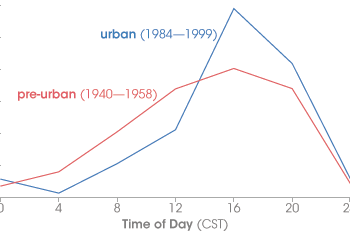
The growth of Houston increased the total rainfall downwind of the city and shifted the timing toward late afternoon. Rain-gauge data from before Houston grew into a big city (red line) shows rainfall spread over a greater part of the day. After urbanization (blue line), more of the day’s rain was concentrated in a narrower time window that peaked around 4:00 p.m. (Image adapted from Burian and Shepherd, 2005.) | |

But location may not be the only factor influencing which mechanism triggers urban rain. “Smaller cities have a different effect than larger cities,” says Shepherd. “Working with a local Houston planning agency, we used a sophisticated urban growth model to make Houston much larger. With the 2025 projected surface area, a much larger heat island is generated, and we don’t see as much of that bifurcated flow around the city...You see more piling up of the air flow over the city. Cloud and rainfall concentrate over the urban areas as opposed to the downwind area.” The area most affected by city-induced rain may shift as a city grows. To Shepherd, growth also means that the urban rain effect will likely become more pronounced in time. “We’re showing with the case of Houston that if you start proliferating more and more of the landscape with urbanized surfaces, you get a change in clouds and precipitation around that city.” Pointing to rapid urbanization—according to the United Nations Population Division, the percentage of people living in cities is expected to increase from 48.8 percent to 59.9 percent between 2005 and 2030—Shepherd continues, “Aggregate that to every city in the world, it undoubtedly has to have an effect on the overall global climate.” But Shepherd doesn’t have to look far into the future to see a need for understanding the urban rain effect. “There are implications certainly for agriculture, urban planning, water resource management, but also for weather and climate forecasting. One of the things that we’re finding very clearly is that cities can affect rainfall, yet many of the weather forecast models that we rely on every day do not include urban land surfaces.” Understanding urban rain could improve the weather forecast for heavily populated regions, giving more accurate warning of potential flood-producing rains. And that information could save human life and property today.
|
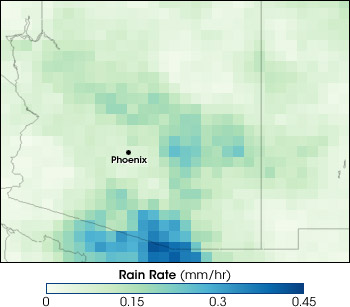
Shepherd detected increased rainfall downwind of Phoenix, a rapidly growing city in arid Arizona. Rising air from Phoenix’s urban heat island may be interacting with nearby mountains to influence the summer monsoon. The map shows average hourly rain rates from July–September 2003. (Map adapted from Shepherd, 2005.) | ||