The Earth Observatory has published its last Image of the Day on this website. Please join us on our new home at science.nasa.gov/earth/earth-observatory.
The Impact of Urban Pollution on Rain | |||
City pollution may also impact cloud formation and rainfall. “Water vapor doesn’t ordinarily spontaneously condense into drops to form clouds,” says climate scientist Tom Bell, from NASA Goddard Space Flight Center. “It needs dirt to form around. All rain needs aerosols to form.” In the natural world, cloud-forming aerosols are things like sea salt, dust, and pollen, all of which are large particles. But pollution aerosols are usually smaller and more numerous than natural aerosols. With lots of particles to collect on, water coalesces into many tiny droplets instead of larger rain-sized drops. The impact on rain, says Bell, varies depending on where the clouds form. In some cases, urban aerosols suppress rain, but in others they increase it. |
|||
 |
|||
What causes the difference? Scientists are still working on that question, but Bell and others believe that the temperature difference between the air near the ground and the atmosphere above may be one key difference. “Bubbles of hot air form over land and rise like a bubble in a pot of boiling water,” says Bell. The rising air cools, and many tiny droplets form around urban aerosols. These small drops are not large enough to fall, so the storm tends not to produce rain. More rain can occur when the bubble of heated air forms over a very warm area, however. “The bubble of heated air rises faster and climbs higher in the atmosphere,” says Bell. Because of urban pollution, “droplets that would normally fall out at a lower elevation are smaller and go higher.” Now high in the atmosphere, the tiny water droplets turn to ice. To make the transition from liquid to solid, the water molecules have to release heat. “The added heat kicks in an ‘afterburner,’ and the bubble of air is pushed up higher and faster,” Bell explains. “The extra boost makes the storm act like a vacuum cleaner,” says Bell. “Something needs to replace the rising air, so more moist air is sucked up.” This vacuum-cleaner effect allows the storm to pull in more material to work with than it would have without the urban aerosols, and more rain results. “The effect only happens when fast-rising air would form a thunderstorm anyway, and when the air near the surface is moist,” Bell adds. Chances are, the urban heat island, city structures, and pollution all interact to alter rain storms around cities. “The real question is which combination of those is the most important factor,” says Shepherd. “Which of those takes the most precedence at the beginning? Is there one of those that takes more precedence at the end, once rainfall gets started? That’s what we’re trying to study right now.” The key to discerning how aerosols, city structures, city heat, and weather systems interact, says Shepherd, may very well be NASA’s fleet of Earth-observing satellites. Taken together, the satellites are providing unprecedented information about land use, cloud structure, rainfall, and aerosols that can then be integrated into models to sort out the intricacies of urban rain. “We need these integrated observing systems like Aqua, CALIPSO, Cloudsat, TRMM, and eventually the Global Precipitation Measurement Mission, along with models to answer these integrated questions,” says Shepherd. Satellites See City RainIt was with these questions in mind—do cities influence rain and if so how—that Shepherd set out to see what NASA satellite data could contribute. The satellite data he had been looking at when he noticed the apparent urban rain anomaly in the first place were from a satellite called the Tropical Rainfall Measuring Mission (TRMM). Among its suite of instruments, TRMM (which scientists pronounce “trim”) carries the world’s only space-based precipitation radar. Like the radar that you see on the evening weather report, TRMM’s Precipitation Radar bounces radio waves through the atmosphere to measure rainfall. The difference is that all other radar systems are ground-based, and therefore have a limited range, whereas TRMM can observe everywhere between about 40 degrees north and south. When combined with GOES weather satellite and rain-gauge data, the rain data analysis can be extended to even higher latitudes. What’s more, because rainfall is measured with a single instrument, TRMM’s estimates in one city can be compared to estimates from another city, something that is difficult to do with two different ground-based systems. |
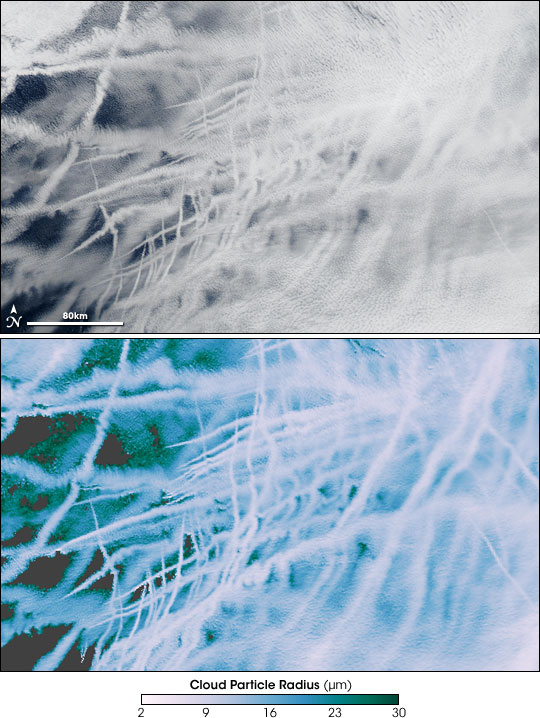
Like urban pollution, the aerosols in ship exhaust change the properties of clouds. These satellite images show clouds over the North Atlantic streaked with ship tracks. The top image is similar to a digital photo, while the bottom image shows the size of cloud droplets from pink (smallest) to green (largest). Compared to droplets formed from naturally occurring aerosols like dust or sea-salt, droplets formed from pollution aerosols are smaller and more numerous. The ship tracks in the image contain droplets as small as 2 micrometers (millionths of a meter), while the clouds in the “background” have droplets that are closer to 20 micrometers. Urban pollution has a similar effect on clouds. (NASA images by Jacques Descloitres, MODIS Land Rapid Response Team, and Mark Gray, MODIS Atmosphere Science Team.) | ||
 |
|||
Pioneering though the instrument is, Shepherd feared that the rainfall data might not be detailed enough to measure the urban rain effect. Each pixel, or data point, that the Precipitation Radar detects measures four kilometers across, and the gridded (combined and mapped) data is even coarser. If the urban rain effect was small, TRMM might not pick up enough data points to detect elevated rainfall totals over and downwind of cities. “But if we could use that satellite data in conjunction with other data sets, then at least we could look at many different cities around the world if we wanted to,” says Shepherd. Spurred by that thought, Shepherd set out to take a careful look at the Precipitation Radar’s rainfall record. |
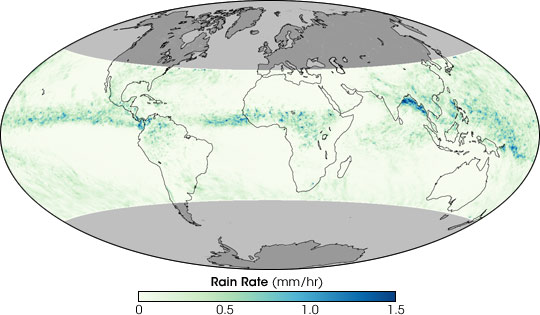
The Tropical Rainfall Measuring Mission (TRMM) monitors rainfall 40° north and south of the equator, far enough north to examine cities in the southern United States. This map shows TRMM observations of average hourly rainfall rates in August 2006. Highest rainfall rates (greens and blues) occur across the Tropics. (NASA image by Robert Simmon, based on TRMM data.) | ||
 |
|||
Working with colleagues Harold Pierce and Andrew Negri, both at NASA Goddard, Shepherd focused on five cities in the south-central and southeastern United States that were not near mountains, major rivers, or oceans—features that themselves impact rainfall. “We wanted to try to isolate that the urban environment was the only thing affecting the circulation,” he explains. He divided this area into a grid where each box measured 0.5 degrees by 0.5 degrees (very roughly a 55 by 55 kilometer square) and tabulated the average amount of rain that fell every hour in each box during the summer (May to September). He then averaged the rain rates over the three summers during which TRMM had collected data, 1998 to 2000, and identified where the most rain fell. He found that the amount of rain that fell per hour was as much as 20 percent greater in grids that were downwind of cities than it was in grids upwind of the city. These results were consistent with ground-based studies of the same regions. It seemed that the cities were generating rain and TRMM could measure the effect, but Shepherd wanted a little more confirmation. He set up a series of rain gauges in Atlanta and recorded how much rain fell around the city during a year. He compared those measurements to TRMM’s measurements. The ground and satellite measurements matched: urban rainfall was real, and TRMM could detect it.
|
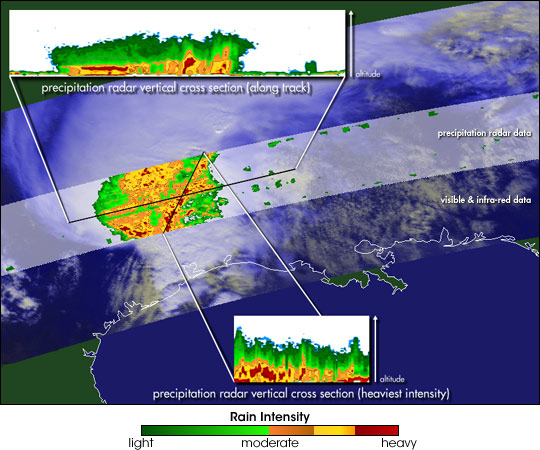
TRMM’s Precipitation Radar maps rainfall in three dimensions along a narrow path underneath the satellite. The radar scans the storm in both the along-track (in the direction the satellite is moving, upper inset) and cross-track (across the width of the swath, lower inset). Other TRMM sensors provide visible and infrared data on the storm. Shepherd and his colleagues used these data to help understand the influence of cities on rainfall. (NASA image by Robert Simmon, based on TRMM data.) | ||
