| Pollution Tracks over Land | |||
Luckily, when Rosenfeld began studying the effects of man-made aerosols on cloud
formation in 1995, he did not investigate pollution sources and aerosols in the eastern United States.
He said that for several years on satellite images, he’d noticed ship track-like features over land in
more pristine areas of the world such as southeastern Australia and Canada. These clouds would start at
a single point on an image and then gently fan out, forming wispy cloud trails that extended up to
thousands of kilometers. "I’m surprised nobody noticed these before," he said. "Or maybe it just didn’t
occur to anyone to study them." |
|||
When he checked on maps and with people he knew who lived in these areas, he found that these "pollution tracks" emanated from man-made pollution sources and were then carried by the wind for hundreds of miles. One of the tracks originated at a mining and smelting compound in Flin Flon in Manitoba, Canada; another was created by a lead smelter plant in Port Pirie, Australia; and still another arose from a power plant in Port Augusta, Australia (Rosenfeld, 2000). Even though these pollution tracks looked like big versions of the ship tracks, Rosenfeld did not assume that they had the same properties. He explained precipitation over land develops differently than it does over the sea. "Over land, cloud
droplets are usually smaller to begin with, so the clouds have to grow larger and deeper for
precipitation to occur," said Rosenfeld. Vertical currents, created by heat rising from the Earth’s
surface, allow the clouds to grow over land. As the water vapor rises, it becomes colder so that
additional condensation occurs, creating bigger and bigger drops as the cloud grows taller.
Precipitation then occurs in one of two ways (Toon, 2000). |
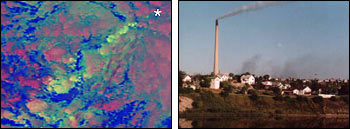
The clouds with small droplets in the image at far left, indicated by yellow, were seeded by the aerosols from the copper smelter in Flin Flon, Manitoba, Canada. Pollution is particularly noticeable from satellites in areas where the air is otherwise clean. (Images by Daniel Rosenfeld, Hebrew University of Israel) | ||
The first way is when the droplets reach a radius of more than 14 micrometers, roughly one-sixth the thickness of a human hair, in the upper layers of the cloud. Smaller droplets just float in the air. But at this 14-micrometers threshold, the drops are just big enough to start colliding with each other and merging into rain drops, which fall without evaporating or being pushed back up by convection currents (Rosenfeld et al., 1998). "Air is then coming up as the rain is coming down through the updraft," explained Rosenfeld. When the raindrops descend through the cloud, they collide with even more droplets and pick up more mass. They get to the point where they’re so large they exit from the cloud altogether and fall to the ground as rain. The second way precipitation occurs is when cloud droplets are pushed so far up in the atmosphere that they freeze. These ice particles can collect the yet unfrozen drops more quickly and evaporate slower than water particles. Once the cloud reaches the point where its upper layers are frozen, the droplets are almost guaranteed to exceed the 14-micrometer limit (Rosenfeld et al., 1998). If the studies on ship tracks did apply to land, then industrial aerosols should be creating droplets so small that they could not reach the precipitation threshold even as the cloud grew to towering heights. In addition, the cloud tops should appear more reflective in satellite data. To see if this was actually occurring, Rosenfeld combined his extensive knowledge of how the atmosphere works with a number of remote sensing techniques, some developed at NASA’s Goddard, and came up with a way to use satellites to estimate the effects the pollutants were having on clouds. The satellite instrument Rosenfeld and his colleagues employed in this first set of experiments was the Advanced Very High Resolution Radiometer (AVHRR) aboard the National Oceanic and Atmospheric Administration’s (NOAA) operational satellites. These satellites move in nearly circular orbits approximately from pole to pole around the Earth and allow the AVHRR to gather imaging data on the planet’s entire surface. The instrument has a number of different sensors (photoreceptors) that detect light of varying colors (wavelengths) being reflected off of or emitted from the Earth. One light detector records only the yellow-green, orange and red visible light coming off the Earth (band 1), one observes the near-infrared light(band 2) just outside the range of human sight, another picks up on all the mid-infrared light (band 3), and still another detects the thermal radiation given off by objects (bands 4, 5). The data these satellites collect are beamed back to the surface, where they can be manipulated and turned into computer images (Hastings, 1998). To measure the growth of the clouds from space, Rosenfeld gathered AVHRR data of the pollution tracks. He
then isolated areas in the satellite data where pollution tracks were present and looked as if they were
affecting the clouds. Using thermal band data, he was able to measure the temperature of the tops of
these aerosol-laden clouds. "The higher the clouds are, the colder they are," said Rosenfeld. Since
cloud tops grow colder because of an increase in altitude, this measurement is equivalent to how
developed the clouds are. He then obtained a rough estimate of the average radius of the droplets on the
cloud tops by forming a ratio between the imaging data of the mid-infrared band and those of the visible
light band (Rosenfeld et al., 1998). Using these manipulated data and a little false color, he created
the somewhat ominous looking computer images he displayed on his laptop. |
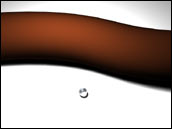 Cloud
water droplets need to have a radius of .14 micrometers before they begin to precipitate—only 1/6 the
radius of a human hair. (Image by Robert Simmon) Cloud
water droplets need to have a radius of .14 micrometers before they begin to precipitate—only 1/6 the
radius of a human hair. (Image by Robert Simmon) |
||
 |
|||
Rosenfeld analyzed these images and satellite data to understand how the clouds were evolving over time and whether the droplets in the clouds were reaching the size needed to precipitate. Essentially, any given image of a string of clouds, polluted with aerosols or not, contains clouds in nearly every stage of development. Some would be fully developed anvil-shaped cumulonimbus clouds and others just thin, marine-like cumulus clouds. "Having only one snapshot, I make the assumption that having different clouds at different heights are equivalent to the same clouds at different times," he said. He then observed the radius of the cloud droplets as the cloud developed to see if the droplets were growing large enough to precipitate. What he found supported the ship track studies. Clouds affected by pollution tracks would grow to be very tall, even to the point where the water was freezing, and yet, the radius of the droplets at the tops of the clouds would not reach the size they needed to precipitate. In unpolluted areas, clouds would begin to precipitate long before they reached heights where the droplets were freezing (Rosenfeld, 2000). From these initial experiments, his conclusion was that the aerosols from power plants and factories alike were breaking up the water in the clouds into droplets so small that they were not reaching the radius needed to precipitate. In addition, it appeared that the pollutants were making it harder for the droplets to freeze even if they reached sub-freezing altitudes. "If this ice process is suppressed then the clouds have no way to precipitate," Rosenfeld noted. Only in rare instances, such as in paper mill emissions, where the aerosols put forth were actually larger than natural aerosols, would the pollutants make the cloud drops bigger and actually cause the clouds to precipitate more than unpolluted clouds. Rosenfeld ran similar experiments with forest and brush fires. Though the biomass burning creates more dispersed polluted clouds than the pollution tracks, the aerosols they put out have a very similar effect on the clouds (Rosenfeld, 1999). |
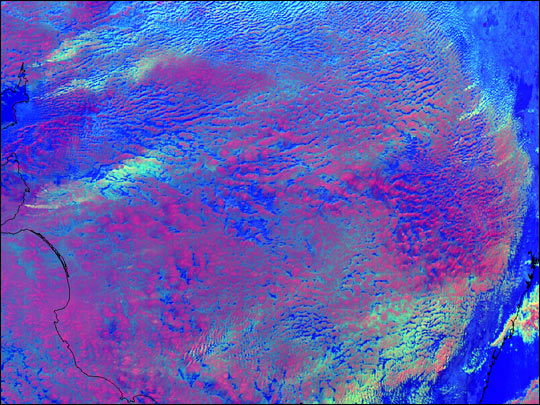
This false-color image over Australia, produced using NOAA AVHRR data, shows where pollution from human industry reduced clouds' particle sizes. Blue areas are cloudless, while purplish-red areas are covered by thick clouds comprised of large droplets. The yellowish-green and orange streaks are clouds comprised of small droplets. These latter clouds are more polluted than the purplish-red clouds and literally pointing to their sources of pollution. Rosenfeld colored the visible, midwave-infrared, and thermal infrared AVHRR data as red, green, and blue, respectively, in this image to differentiate clouds with different properties in a three-dimensional way. Red was used to indicate the reflectiveness of the cloud in visible wavelengths. Green corresponds to droplet size. The more green there is in an area (as determined by AVHRR measurements of energy reflected at the 3.7 micrometer wavelength) the smaller the droplets. Blue was used to represent the clouds' temperature. The deeper the blue, the warmer the temperature (determined by AVHRR measurements of brightness temperature at 10.8 micrometer wavelength). (Image by Daniel Rosenfeld, Hebrew University of Israel) |
||