| Seeing Through the Clouds | |||
"The problem with AVHRR is that we cannot penetrate the clouds, so the results were not considered to be conclusive evidence," said Rosenfeld. Because the NOAA instrument could only view the tops of the clouds, it could not measure how much water the clouds contained or if the water droplets beneath the surface of the cloud, for some unseen reason, were reaching precipitation radius. So these initial findings could not be considered definitive proof that aerosols were having an effect on the precipitation. Then, with the launch of NASA’s Tropical Rainfall Measuring Mission (TRMM) satellite in 1997, Rosenfeld saw an opportunity to prove his speculations. This satellite was initially launched to measure tropical precipitation and to estimate the vertical profile of the resultant latent heat of condensation released into the atmosphere, leading to an understanding of the role played by this heat in driving the circulation of the global atmosphere. The satellite orbits the Earth traveling from west to east, back and forth across the equator, taking measurements of the clouds above our planet’s surface each day from 35 degrees latitude north of the equator to 35 degrees south. In the Western Hemisphere, this zone extends roughly from the northern border of Alabama to the southern tip of Uruguay (Graham, 1999). |
 |
While TRMM does have an instrument called a visible and infrared sensor that retrieves the same type of data as AVHRR, it also contains two additional instruments for viewing what occurs inside the clouds. The first, known as the precipitation radar, does exactly what its name implies — it bombards the clouds with radio waves and then receives the signals that bounce back. The radar is rigged so that the only signals that bounce back are from droplets that are at least the size of raindrops. By retrieving data from this instrument, scientists can tell whether a cloud is precipitating or not. The other instrument vital to Rosenfeld’s research is known as the passive microwave imager. This instrument picks up solely on one frequency of microwave radiation that cloud water and ice absorb and emit (Rosenfeld, 1999). "So the passive microwave is something that is sensitive to the total amount of water in the cloud with a little sensitivity to the size of the particles," Rosenfeld explained. In short, when low microwave readings show up on this instrument for clouds floating above a landmass, it means that the clouds as a whole contain much water. Rosenfeld gathered TRMM satellite data over many of the same factories and power plants he examined with AVHRR. Using the visible and infrared sensor instrument data, he compiled estimates of effective radius and cloud top temperature on both polluted and unpolluted clouds. The results were nearly identical to the readings he derived from the AVHRR data. Rosenfeld then looked at the precipitation radar and microwave imaging data to see what was going on inside the clouds. Sure enough, the clouds in the path of the aerosols were not precipitating. Like the ship tracks, the clouds contained significantly more water than unaffected clouds, and they were on average brighter from above (Rosenfeld, 2000). Again, he ran the same tests on forest and brush fires and came up with an identical conclusion (Rosenfeld, 1998). As a follow up to these experiments, Rosenfeld approached the engineers at these factories that were producing the pollution tracks and asked them how many aerosols their plants’ produced. The results were what he expected. The plant in Port Augusta, for instance, was putting out nearly 43 kilograms per hour of ash particles that were all the right size for breaking up the water in clouds. "And they were using electrostatic precipitators, which capture most of the ash," said Rosenfeld. He also found that the type and number of cloud condensation nuclei coming from these smokestacks was much more varied and potent than the ship tracks. Ship tracks generally burn diesel fuel that throws sulfur dioxide into the air, which becomes sulfate aerosols through chemical reactions. On the other hand, factories put out not only sulfur dioxide, but also a large number of smoke and ash particles. These react immediately with the clouds and moisture in the air, so that the suppression of the cloud precipitation starts at the stack and then become more pronounced as the sulfur dioxide converts to sulfate aerosols. |
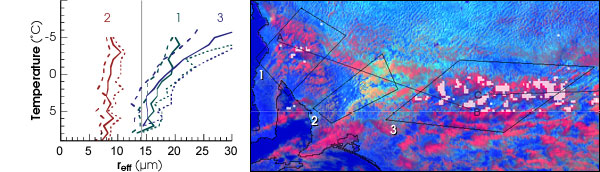
Simultaneous measurements of rainfall and cloud properties by satellite demonstrate that pollution can inhibit rainfall. The graph above shows cloud droplet radius versus temperature (equivalent to altitude) in three regions of the image above. Regions number 1 and 3 are in clean air (pink clouds), while region 2 (downwind of Adelaide, Australia) is polluted (yellow clouds). The cloud droplets in the unpolluted areas were above 14µm, and TRMM's Precipitation Radar showed that the clouds were precipitating (white overlay). In region 2, however, the water droplets remained small even at high altitudes, and no rain was falling. (Image by Daniel Rosenfeld, Hebrew University of Israel) |
