It took someone with an entirely different perspective to tame the lion; it took a Dutch engineer who was more interested in practical applications than the exacting precision of science. Engineer and humanitarian Wim Bastiaanssen wanted to find a way to calculate water use so that he could help developing countries find ways to use water more efficiently to grow food. Allen had heard of Bastiaanssen’s work at a conference and thought his approach might work in Idaho.
“He [Bastiannssen] said, look, we just don’t know surface temperature accurately enough, we don’t know air temperature accurately enough. So how about if we just invert this whole process…Let’s just back-calculate what it [the heat transferred to the atmosphere] has to be to explain what we know about evapotranspiration,” says Allen.
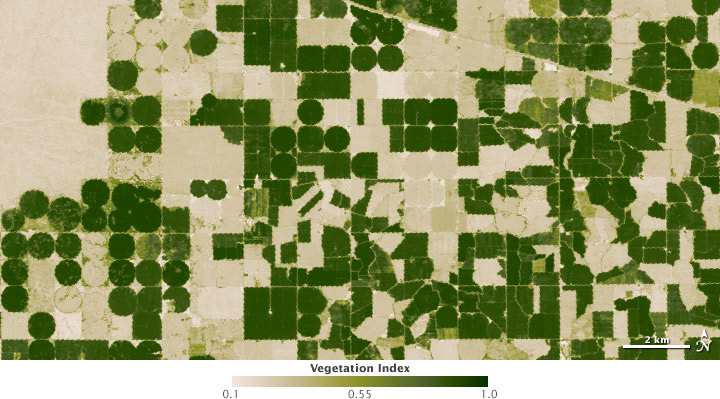
Bastiaanssen asked, are there any conditions in a Landsat image where we know what the evapotranspiration is? “The answer is yes,” says Allen. “There are two extreme conditions that we know.” First, little to no evapotranspiration occurs in bare, dry soil. Such a pixel will appear hot in Landsat thermal images. By assuming the amount of heat being used for evapotranspiration was zero (or nearly zero) in this pixel, and knowing the ground surface temperature, Bastiaanssen discovered that he could calculate how much of the incoming solar energy was being transferred to the air as heat at that one location.
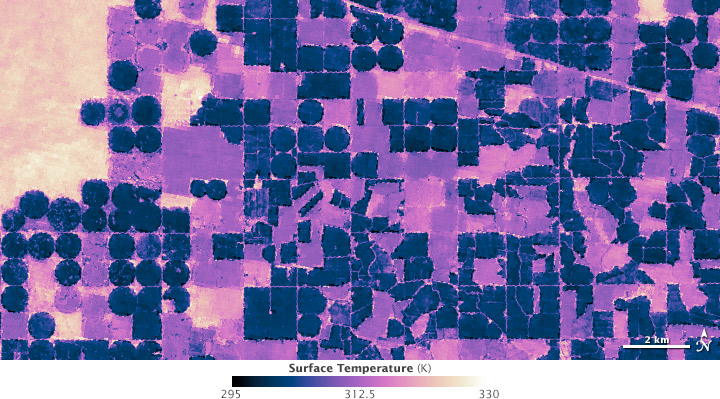
Bastiaanssen then set his eyes on the other extreme: he found nearly the coldest pixel in the thermal data. (The coldest pixels, says Allen, are usually standing water or data artifacts.) Since evapotranspiration cools the surface, a cool pixel in an agricultural area would be one that is plant-covered; at that location, it would be reasonable to assume that most of the available energy is being used in evapotranspiration, not heating.
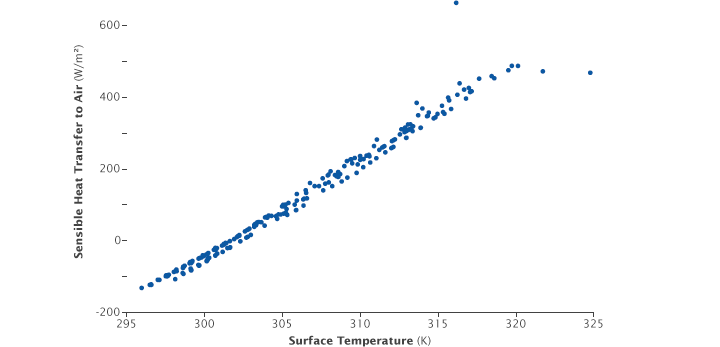
Once the scientists knew how much of the available energy was being transferred to the air at the two extremes (the places with the lowest and highest evapotranspiration rates), they simply calculated the mathematical relationship between them, which looked like a gently sloping curve on a graph. The relationship defines the difference between surface and air temperature without requiring a precise measurement of either. Figuring out how much energy was being transferred to the air at other, intermediate, places was simply a matter of figuring out where those locations would fall along the curve.
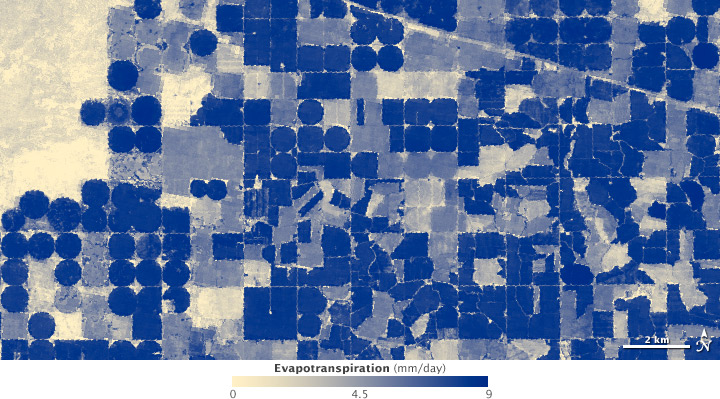
“I can take that relationship between temperature gradient and surface temperature and apply it to all 30 million pixels in my image,” says Allen. “From that I calculate evapotranspiration for every pixel.”
When Allen, Morse, and Kramber began adapting Bastiannssen’s approach to Idaho, they used precise calculations of evapotranspiration from agricultural weather stations near water-intensive crops, rather than assuming that virtually all the energy in a scene’s coldest pixel was being used in evapotranspiration. Because they knew the evapotranspiration rate from ground measurements, they could combine that with Landsat observations of ground heating to calculate even more precisely how much energy was transferred to the air over the crop.
Since they could now calculate how much of the available energy was heating the ground and the air, they could estimate how much was being used for evapotranspiration. In other words, they now had a way to see water “spending” for every 900-square-meter area of land (a 30 meter pixel): they could see just how much water was being consumed from field to field.
