| |
In addition to determining why the warm pool oscillates, perhaps a more
important question for both researchers and lay people is what affect does this warm pool oscillation
have on the world’s climate? If scientists could discern how the cyclical behavior of the warm pool
influences the weather, then there is the possibility that they could better predict future weather
patterns by observing warm pool temperatures. Mehta explains that although very little research has been
done on the warm pool oscillation’s influence on the world’s climate, there is evidence that it is
profound. “A few degrees difference in the warm pool may not seem like much. However, even a small
change in a body of water as extensive and warm as this can have great effect on the climate,” says
Mehta.
|
|
|
| |

He elaborates that the warm pool oscillation’s climatic sway stems from the fact that the average
temperature of the oscillation is 84°F (29°C). This temperature has a special significance in Mother
Nature. It is the threshold temperature at which air at the ocean’s surface begins to rise rapidly,
causing strong atmospheric convection (vertical air currents). The upward moving air (called
“convection” ) can carry evaporated seawater high into the atmosphere where it condenses to form clouds
and entire weather systems. Atmospheric convection can also create a low-pressure zone above the ocean
and alter the surrounding air currents. “So as you move up or down by a degree at this temperature, you
can make a big impact,” Mehta says.
|
|
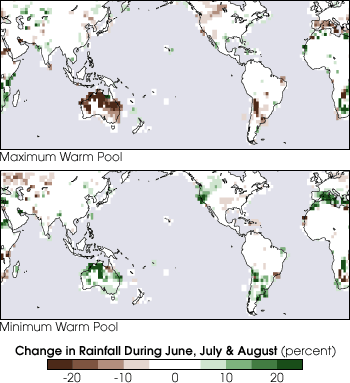
The Warm Pool affects the climate, particularly rainfall, around
the world. During the months of June, July, and August, a large Warm Pool results in up to 25 percent lower
than normal rainfall in Australia and South America, while a smaller than normal Warm Pool is correlated
with an increase in rainfall in Australia, the Pacific Northwest, and the Mediterranean. The maps to the
left show rainfall while the Warm Pool was large (top) and small (bottom), based on data acquired from 1908
to the present. (Images courtesy Vikram Mehta, NASA GSFC)
|
| |

A number of scientists have already published papers showing that the oscillation and the corresponding
atmospheric changes alter the weather in Australia and in the island nations of the South Pacific.
Mehta, however, is focused on the Western Hemisphere. He is curious as to how the oscillation may be
altering El Niño in the eastern Pacific.
For those who have forgotten what El Niño and La Niña are all about, in a non-El Niño year, trade winds
blow continuously in the winter from east to west along the equator and push the warm surface waters off
the coast of South America surface waters toward the west. When El Niño hits periodically—roughly every
three to seven years—these equatorial winds cease over the winter months and warm water is allowed to
build up along the northwestern coast of South America. During a La Niña winter, the opposite
occurs—trade winds increase and push even more water westward, away from the eastern Pacific. Needless
to say, both events are known to affect the weather from Australia to the eastern coast of Africa.
|
|
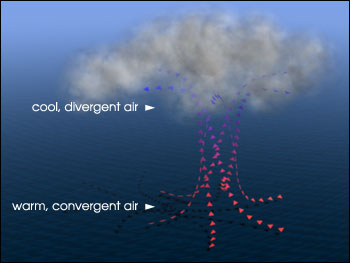
The Warm Pool is important because the water within it is warm
enough—28.5 °C—to cause convection. Convection is the process in which hot air at the surface rises,
bringing with it moisture evaporated from the ocean. As the air rises it cools, and the water within it
condenses to form clouds. The same process leads to afternoon thunderstorms in the summer. In general, air
is converging towards the warm pool at the surface, and diverging away from the warm pool at high altitudes.
(Image by Robert Simmon, NASA GSFC)
|
| |

Considering that both the warm pool oscillation and the El Niño/La Niña share some of the same waters,
the idea that the two have an influence on one another isn’t far fetched. To see if a connection exists,
Mehta compared El Niños from 1909 to 1988 to the warm pool oscillation. He gathered sea surface
temperature data of the eastern Pacific from nineteen El Niño events and separated them into two
categories—those that occurred when the warm pool was cooler than the average temperature of its
oscillation and those that occurred when the warm pool was warmer than average. He then ran a few basic
comparisons to see if there were any differences between the two categories.
He found that when the warm pool is at the peak in its oscillation, the warm waters associated with El
Niño not only blanket the waters off the coast of South America, but spread out far into the central
Pacific. During these winters, the warm El Niño and warm pool waters together covered nearly the entire
equatorial Pacific. When the warm pool was at a low in its oscillation, the warm waters characterizing
El Niño stayed pretty much confined to South America. “Essentially the difference [between the two
variations of El Niño events] lies mostly in the central Pacific,” says Mehta.
He explains that such a change in El Niño may have an impact on everything from the jet stream in the
Northern Hemisphere to ocean life along the equator to the moisture content in the air above the
Pacific. Some of these large-scale changes in the ocean and atmosphere, in turn, could alter the weather
in the United States and Canada. Mehta says that in order to test this hypothesis, he first gathered all
the precipitation data from North America during a combined 37 El Niño and La Niña events that occurred
between 1908 and 1998. He again split these data into two categories—the winter precipitation data from
when the warm pool was above average in its oscillation and those from when the warm pool was below
average.
“In the end, we discovered that when the warm pool shrinks down and becomes not so warm you get a much
stronger correlation between El Niño and La Niña and the rainfall in the central United States and
central Canada. A negative correlation also exists in the [Pacific] Northwest,” Mehta says. In basic
terms, when the warm pool is cooler than average, both El Niño and La Niña seem to increase
precipitation in the mid-western United States and central Canada and decrease precipitation in the
northwestern United States. Conversely, when the warm pool is large, El Niño and La Niña appear to have
very little influence on these regions of the country. Mehta warns, however, that these correlation
tests cannot tell him how much rainfall has increased or decreased. It can only tell him that El Niño
and La Niña seem to be causing more or less precipitation depending on what phase the warm pool
oscillation is in.
As is typically the case in atmospheric science, an explanation of why a phenomenon occurs is often not
worked out until well after the phenomenon is discovered. Mehta says that right now he and his team are
wrestling with atmospheric models and climate data to see if they can uncover how the warm pool is able
to affect El Niño and La Niña and the weather in North America. The scientists believe, among other
possibilities, that the warm pool could be altering the atmospheric circulation above the Pacific,
changing the depth of the top warm layer of the Pacific, influencing the jet stream, or affecting all of
the above. “But more research has to be done,” says Mehta. “We are right there at the edge. Exciting,
highly statistical results can turn out to be bogus sometimes. You have to be careful.”
 Running Hot and Cold Running Hot and Cold
|
|
The image above shows the changes in water temperature (color),
sea surface height (elevation), and winds (arrows) that occured during the strong El Niño of December
1997. During an El Niño, the trade winds that usually blow from east to west flip-flop and blow from
west to east, pushing the water of the West Pacific Warm Pool into the eastern Pacific. The larger the
Warm Pool, the stronger the El Niño tends to be. (Image courtesy Greg Shirah, NASA GSFC Scientific
Visualization Studio) |

