| |
“The dimensions of the Indo-Pacific warm pool are huge. If you look on a map, it
extends for 9,000 miles east to west along the equator and 1,500 miles north to south,” says Mehta. “So
there’s a lot of warm water sloshing around there.” The warm pool is shaped a bit like a tadpole with
its head covering the waters of the western equatorial Pacific between New Guinea and the Samoa Islands
and its tail extending through the Indonesian Archipelago and well into the Indian Ocean. All in all,
the warm pool blankets an area of the ocean four times the size of the continental United States. Its
temperatures average anywhere from 81°F (27°C) at the edges to up to 86°F (30°C) in the center of its
eastern bulge.
Mehta and his team began their investigation of the warm pool by analyzing sea surface temperature data
of the Pacific from 1908 to 1988. They pieced these data together from a number of different sources
ranging from measurements taken aboard early twentieth-century English merchant ships to remote sensing
measurements collected by NASA and NOAA satellites. “From these data, we’ve seen that the size and the
temperature of the warm pool undergo variability at many different time scales,” Mehta says. He explains
that on a yearly basis, this warm water will migrate a little south of its average position during the
Northern Hemisphere’s winter and a little north of its average position during the Northern Hemisphere’s
summer. Over the course of a La Niña or El Niño year, when the trade winds across the Pacific change for
the winter, the eastern edge of the warm pool will often advance or pull back over the period of a few
months.
What has piqued Mehta’s curiosity, however, aren’t these relatively short-term, periodic changes in the
warm pool, but what happens over the long run. “The interesting thing is that you can see this very slow
oscillation over a period of 10 to 20 years,” says Mehta. He explains that when you look at just the
yearly average temperatures of the warm pool, they can be seen to grow warmer and then cooler on a
periodic basis, roughly every two decades, as if connected to a dimmer switch. Typically, when the
eastern part of the pool is at its peak, such as in 1926, 1943, and 1960, the temperatures will go as
high as 86°F (30°C) on average in the swollen eastern section and the warm pool will expand. The warm
pool will then begin to shrink as the yearly average temperatures drop for roughly another decade, down
to less than 84°F (29°C) at the warmest spot. The whole cycle then starts anew.
“So the warm pool is expanding and contracting,” says Mehta. “But where does this excess heat come from
to make the warm pool large and where does it go when it’s small?” The sun is always shining bright on
the equator so water temperatures there are warm to begin with. In addition, trade winds normally blow
from east to west along the equator and sweep warm eastern Pacific surface waters toward the west.
|
|

The size of the warm pool waxes and wanes over a period of about a decade. During this
time, the excess heat circles around the Pacific and Indian Oceans. The above maps show sea surface
temperature anomaly (the difference between normal conditions and measured conditions) before, during,
and after a peak in the size and strength of the warm pool. Excess heat circles from the eastern Pacific
along the coast of North and South America, to the northern and southern Pacific Ocean, to the West
Pacific and Indian Oceans, and back. (Images courtesy Vikram Mehta, NASA GSFC) |

|

But sunshine and trade winds alone shouldn’t give rise to a localized warm pool in the Indian and western
Pacific Ocean or cause these waters to cyclically move up or down a few degrees over 20 years in a
rhythmic pattern. To solve this riddle, Mehta and his team have been analyzing atmospheric and
subsurface ocean temperature data of the Pacific. “I’ve been using these data to try to piece the whole
picture together as to how the changes at the ocean’s surface are tied to what happens deep in the ocean
and in the atmosphere,” says Mehta.
The team now believes that the warm pool’s growth may stem from a fluctuation in subsurface currents.
These currents, which are located several hundred meters below the ocean’s surface, travel from an area
east of Japan to the warm pool. What Mehta’s data reveal is that the currents may be periodically
gathering warm surface water from the subtropical Pacific and slowly channeling it beneath the ocean’s
waves to the warm pool.
“Currently, we are looking into what happens to the heat when the warm pool shrinks and then grows
small,” says Mehta. One theory is that every decade or so the currents turn from hot to cold and
gradually decrease the warm pool temperatures. Another theory is that the warm pool reaches a peak
temperature and then vents its excess heat into the atmosphere before growing again. Right now the
researchers are continuing to look at subsurface ocean currents, air pressure above the warm pool, and
various other forms of atmospheric data to find an answer.
 An Oscillation Felt Around the World An Oscillation Felt Around the World
 West Pacific Warm Pool West Pacific Warm Pool
|
|
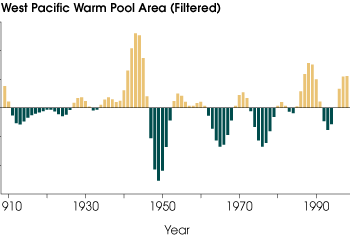
The graph to the left shows the percent change in size of
the West Pacific/Indian Ocean Warm Pool over time. The data were filtered to show the long-term
fluctuations, a period of 9 to 12 years. (Graph courtesy Vikram Mehta, NASA GSFC) |

