

Arctic sea ice occupies an ocean basin mostly enclosed by land. Because there is no landmass at the North Pole, sea ice extends all the way to the pole, making the ice subject to the most extreme oscillations between wintertime darkness and summertime sunlight. Likewise, because the ocean basin is surrounded by land, ice has less freedom of movement to drift into lower latitudes and melt. Sea ice also forms in areas south of the Arctic Ocean in winter, including the Sea of Okhotsk, the Bering Sea, Baffin Bay, Hudson Bay, the Greenland Sea, and the Labrador Sea.
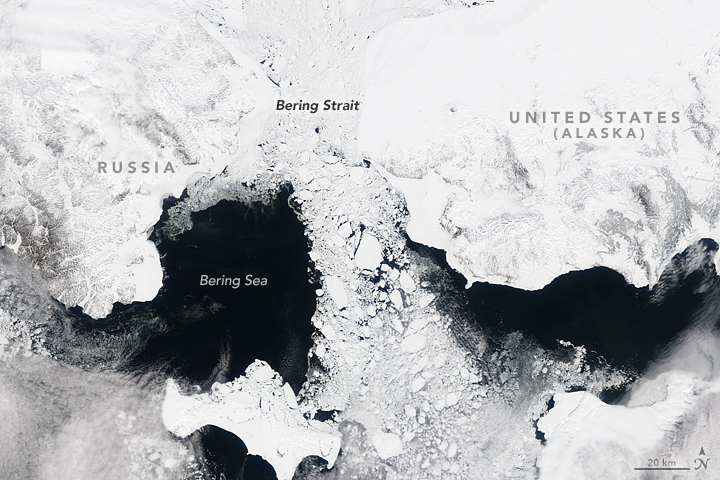
The Bering Strait is one of the few outlets through which sea ice exits the Arctic Ocean. (NASA Earth Observatory image by Joshua Stevens and George Riggs using data from Terra MODIS.)
Arctic sea ice generally reaches its maximum extent each March and its minimum extent each September. This ice has historically ranged from roughly 14-16 million square kilometers (about 5.4-6.2 million square miles) in late winter to roughly 7 million square kilometers (about 2.7 million square miles) each September. In recent years, however, those numbers have been much lower.
On time scales of years to decades, the dominant cause of atmospheric variability around the North Pole is the Arctic Oscillation. The AO is an atmospheric seesaw in which air masses shift between the polar regions and the mid-latitudes. The shifting can intensify, weaken, or move the location of semi-permanent low and high-pressure systems. These changes influence the strength of the prevailing westerly winds and the track that storms tend to follow.
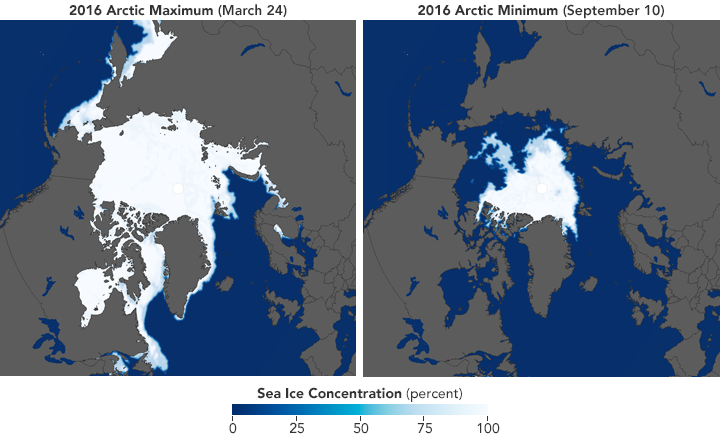
The minimum Arctic sea ice extent occurs in September. The maximum is in February or March. Arctic sea ice maxima and minima have been shrinking for three decades. (NASA Earth Observatory maps by Joshua Stevens, based on AMSR2-E data from NSIDC.)
During the “positive” phase of the Arctic Oscillation, winds intensify, which increases the size of leads in the ice pack. The thin, young ice that forms in these leads is more likely to melt in the summer. The strong winds also tend to flush ice out of the Arctic through the Fram Strait. During “negative” phases of the oscillation, winds are weaker. Multiyear ice is less likely to be swept out of the Arctic basin into the warmer waters of the Atlantic.
However, in recent years, the relationship between the Arctic Oscillation and summer sea ice extents has weakened. For example, a strong negative phase in the winters of 2009 and 2010 was not enough to maintain high levels of ice cover. Clearly some other factors can override the relationship.
In September 2015, Arctic sea ice reached a minimum extent of 4.41 million square kilometers (1.7 million square miles)—the fourth lowest in the satellite record. The ice then grew during the winter months and reached its annual maximum extent in March 2016, measuring 14.52 million square kilometers (5.61 million square miles). By September 2016, sea ice dropped to 4.14 million square kilometers (1.6 million square miles), the second lowest extent of the satellite era.
The record lowest minimum occurred in September 2012 when sea ice plummeted to 3.41 million square kilometers (1.32 million square miles). That was well below the previous record of 4.17 million square kilometers (1.61 million square miles) set in 2007, when Arctic sea ice extent broke all prior records by mid-August, more than a month before the end of melt season. Since the mid-2000s, low minimum extents in the Arctic have become the “new normal.”
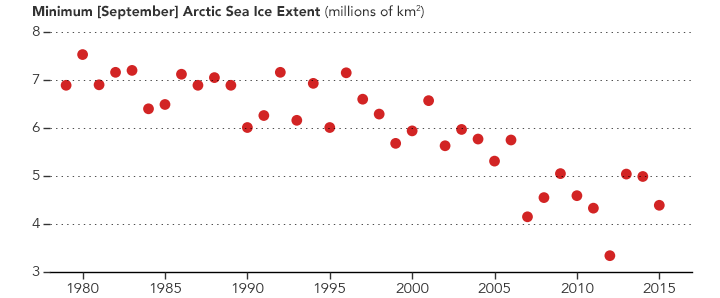
Between 1979 and 2015, the average monthly extent for September declined by 13.4 percent per decade. In every geographic area, in every month, and every season, Arctic sea ice extent is lower today than it was during the 1980s and 1990s.
Natural variability and global warming both appear to have played a role in this decline. The Arctic Oscillation’s strongly positive mode through the mid-1990s flushed thicker, older ice out of the Arctic, replacing multiyear ice with first-year ice that is more prone to melting. After the mid-1990s, the AO was often neutral or negative, but sea ice failed to recover. Instead, a pattern of steep Arctic sea ice decline began in 2002. The AO likely triggered a phase of accelerated melt that continued into the next decade because of unusually warm Arctic air temperatures.
| Year | Average Minimum Extent (millions of km2) | Extent Relative to 1981-2010 Average (millions of km2) | Difference from 1981-2010 Average (percent) |
|---|---|---|---|
| 2002 | 5.95 | -0.55 | -8.53 |
| 2003 | 6.13 | -0.37 | -5.76 |
| 2004 | 6.04 | -0.46 | -7.15 |
| 2005 | 5.56 | -0.94 | -14.53 |
| 2006 | 5.91 | -0.59 | -9.15 |
| 2007 | 4.29 | -2.22 | -34.05 |
| 2008 | 4.72 | -1.79 | -27.44 |
| 2009 | 5.38 | -1.13 | -17.29 |
| 2010 | 4.92 | -1.59 | -24.37 |
| 2011 | 4.61 | -1.90 | -29.13 |
| 2012 | 3.62 | -2.89 | -44.35 |
| 2013 | 5.35 | -1.16 | -17.76 |
| 2014 | 5.28 | -1.23 | -18.83 |
| 2015 | 4.63 | -1.88 | -28.82 |
Many global climate models predict that the Arctic will be ice free for at least part of the year before the end of the 21st century. Some models predict an ice-free Arctic by mid-century. Depending on how much Arctic sea ice continues to melt, the ice could become extremely vulnerable to natural variability in cycles such as the Arctic Oscillation.
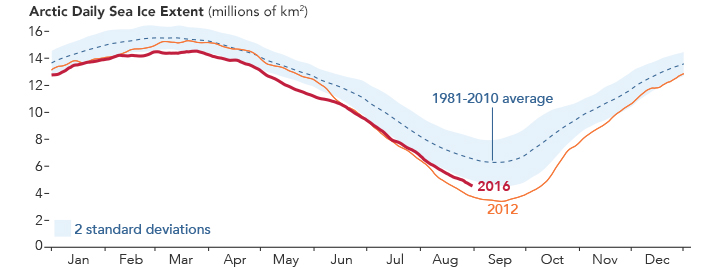
Arctic sea ice cover peaks each year in March, and reaches its minimum in September. In 2012 arctic ice reached the lowest extent ever recorded, well below the historical average (blue dashed line). (Earth Observatory graph by Joshua Stevens, based on data from the National Snow and Ice Data Center.)
Declining sea ice will lead to a loss of habitat for seals and polar bears; it also should increase encounters between polar bears and humans. Indigenous peoples in the Arctic have already described changes in the health and numbers of polar bears.
As sea ice retreats from coastlines, wind-driven waves—combined with thawing permafrost—will likely lead to more rapid coastal erosion. Other potential impacts include changed weather patterns. This is an area of active research, as scientists try to tease out the possible links between sea ice loss and mid-latitude weather patterns.
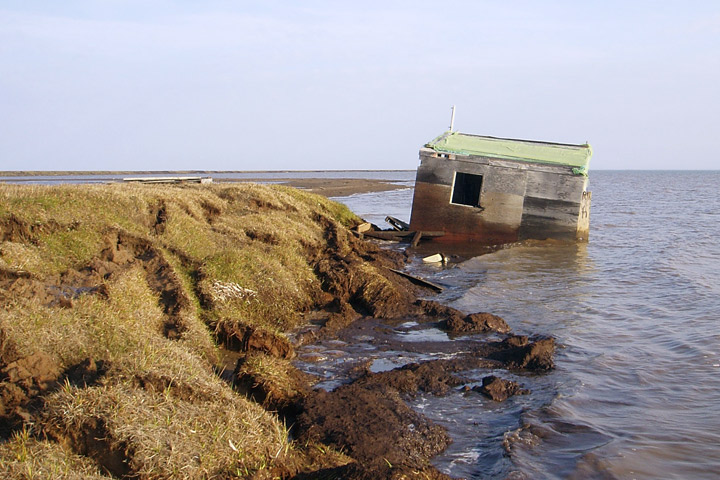
The loss of sea ice exposes shorelines to the full force of wind and waves, resulting in rapid erosion. This cabin fell into the Beaufort Sea, a region where some coastlines retreated more than 24 meters (80 feet) in 2007. (Photograph courtesy Benjamin Jones, USGS.)
Some researchers have hypothesized that melting sea ice could interfere with ocean circulation. In the Arctic, ocean circulation is driven by the sinking of dense, salty water. Fresh meltwater coming primarily from the Greenland Ice Sheet could interfere with ocean circulation at high latitudes, slowing it down. Changes in the location and timing of sea ice growth—where the dense salty waters are formed and then sink to the bottom—may also be an important factor.