 | |||
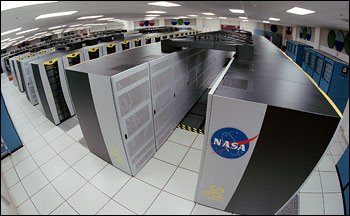
by Holli Riebeek· design by Robert Simmon· November 14, 2006 Scientists are using the theories they have constructed to explain the paleoclimate data record (see Part 5 in this series: Explaining the Evidence) to understand the modern climate and to predict how we can expect it to change in coming years or decades. To test climate theories, scientists at NASA’s Goddard Institute for Space Studies (GISS) and elsewhere are building powerful mathematical models that can show how changing conditions on the Earth and in the atmosphere affect climate. The most sophisticated models might represent the Earth as a three-dimensional grid with the atmosphere split into ten different grid layers each containing 65,000 reference points. Scientists might have the computer model calculate what the effect of increasing carbon dioxide and air pollution would be at each of those 65,000 reference points. These highly detailed models of the Earth’s climate system must be run on supercomputers, some of which perform more than 80 million calculations every hour. |
| ||
As complex as they are, however, there are some things the models can’t explain. “We can’t get the models to do some things like rapid climate change,” says Gavin Schmidt, a climate modeler at GISS, reflecting on the sudden decade of warming that finally ended the last Ice Age. “We [humanity] owe our entire history to the fact that that happened, and we don’t know why it did.” Schmidt wants to find the key to this climate mystery, and to do so, he is relying on satellite data and paleoclimate information to refine the climate models in the hopes that he might uncover some otherwise hidden process at work in Earth’s climate. In explaining how the model, and satellite and paleoclimate data come together, he recalls the 1991 eruption of Mount Pinatubo. Putting Models to a Real-World TestIt was nearly nine o’clock on a sunny June morning when Mount Pinatubo belched forth its first explosive eruption in over 500 years. It had been sending forth ash-laden steam clouds in warning for days, but on June 12, 1991, the volcano began a four-day eruption that would become one of the most violent and destructive eruptions of the twentieth century. The eruption culminated on June 15 with a massive nine-hour long explosion that sent a thick gray cloud of ash 34 kilometers into the atmosphere. Within two hours of the start of the climactic eruption, the cloud measured 400 kilometers in diameter. Ash wasn’t the only thing the volcano released into the atmosphere—scientists later estimated that Pinatubo spewed about 17 million tons of sulfur dioxide into the stratosphere, most of it during the final eruption. The gas became sulfate aerosols (tiny, reflective particles) in the stratosphere, far above the level where rain clouds form. Carried by strong winds, the sulfate aerosol encircled the Earth within three weeks. For more than a year after the eruption, the aerosol cloud covered the entire Earth, shielding it from the Sun’s energy. Global temperatures fell by about 0.5 degrees Celsius, and the amount of atmospheric water vapor decreased. |
Climate models provide researchers with a tool to predict future climate and to understand changes that occurred long ago. Dependent on billions of calculations, cutting-edge models require the fastest supercomputers. (NASA photograph courtesy Tom Trower, Ames Research Center.) | ||
 | |||
Mount Pinatubo’s eruption was the largest eruption ever observed by satellite. Satellites also collected data about the effects of the eruption on the climate, providing climate modelers a wealth of information. Scientists eagerly plugged the sulfate measurements from the satellite data into climate models—if the models mimicked reality, they were probably accurate. “It turns out that most of the effects were well-modeled—it got cooler by about the right amount, and the water vapor feedback seemed to be well captured,” says Schmidt. The models, however, had one major flaw. In the winter following the eruption, actual temperatures in Eurasia were higher, not lower, than normal. The models failed to reproduce this winter warming. |
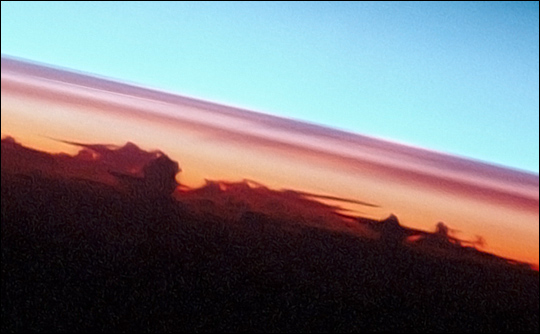
Aerosols injected into the stratosphere by the eruption of Mount Pinatubo cooled the Earth for several years after the eruption. An astronaut aboard Space Shuttle Atlantis photographed a layer of aerosols lit by the setting sun on the Earth’s horizon. (Astronaut photograph STS43-22-12 courtesy NASA JSC Earth Observations Lab.) | ||
 |
Overall, computer analysis of the Pinatubo eruption accurately modeled the effects of aerosols on global surface (tropospheric) temperatures and water vapor concentrations. Red lines in these graphs represent changes calculated by different runs of a computer model, while the blue lines represent observations in tropospheric temperature (top) and water vapor (below). (Graphs adapted from Soden et al., 2002, copyright AAAS 2002*.) | ||
Global climate models, Schmidt notes, don’t generally do a good job with the stratosphere—the section of the atmosphere affected by Pinatubo’s sulfate aerosols. At 8 to 50 kilometers above the Earth, the stratosphere doesn’t influence weather, so only a few models had been built to describe it. Those models were designed to understand changes in the stratospheric ozone layer, and they alone predicted winter warming over Eurasia after Pinatubo. Looking at the global patterns of temperature change, scientists suspected that the North Atlantic Oscillation (NAO) had been affected by the sulfate cloud. The NAO is the balance between the high-pressure weather system permanently parked over the Azores Islands in the mid-Atlantic Ocean and the low-pressure system over Greenland. When the NAO is positive, the high becomes especially high, and the low becomes especially low. The dramatic pressure difference between the two systems favors strong winter storms that cross the Atlantic on a northerly track, sparing Europe. In general, a positive NAO pattern warms Eurasia, just as Mount Pinatubo’s eruption did. (For more information, see “Searching for Atlantic Rhythms.”) Answers from the PastHow could the eruption of a volcano in the Philippines change a weather pattern over the Atlantic? Aerosols in the stratosphere change the way planetary waves behave. Planetary waves, Schmidt explains, are the big wiggles in the jet stream that you see on weather maps. Changes in planetary waves should also affect the NAO, and the types of changes that aerosols induce tend to make the NAO positive. Schmidt and others built the idea into climate models, and the results matched the observed warming. To further confirm the idea that stratospheric changes were linked to the NAO, they investigated paleoclimatology data from an era during which scientists suspected stratospheric changes had also occurred: the Maunder Minimum. Between 1650 and 1710, a period known as the Maunder Minimum, the Sun was relatively quiet, bombarding the Earth with fewer ultraviolet rays than normal. Decreases in the amount of ultraviolet energy hammering the Earth change the stratosphere by decreasing the amount of ozone that is produced. During the same period, paleoclimate data showed that Europe was colder than most other areas. Scientists estimated how much ozone levels would have decreased during the Maunder Minimum based on the decrease in ultraviolet energy from the Sun, and they plugged the information into global climate models. “A change in the stratosphere gave a change in the NAO,” Schmidt says. In fact, the models said the NAO should have been more negative on average during the sixty-year period, resulting in cooler temperatures over Europe. |
|||
 | |||
Paleoclimate and satellite data came together to help scientists build a better model of how the stratosphere influences the North Atlantic Oscillation. This revised model was able to reproduce the unusually cold temperatures over Europe during the Maunder Minimum, when changes in ultraviolet radiation and ozone appear to have shifted the NAO into an extended negative phase. The model was also able to reproduce the unusually warm temperatures over Europe after the Pinatubo eruption, when aerosols in the stratosphere changed the pattern of planetary waves, and the NAO became positive. Paleoclimatology can also provide the information needed to validate and refine other models that might offer insight to things like rapid climate change. In this way, paleoclimatology not only allows us to see into the past, but is also helping us to understand how the Earth’s climate works now and to predict how human activity might impact the climate in the future.
*Terms and conditions of use for material copyright AAAS: Readers may view, browse, and/or download material for temporary copying purposes only, provided these uses are for noncommercial personal purposes. Except as provided by law, this material may not be further reproduced, distributed, transmitted, modified, adapted, performed, displayed, published, or sold in whole or in part, without prior written permission from the publisher. |
Reduced solar output led to lower temperatures in much of the Northern Hemisphere during the Maunder Minimum, in the late 1600s. This map represents the temperature difference between 1680 (during the Maunder Minimum) and 1780 (a period of normal solar activity) calculated by a general circulation model. Blue areas were colder than normal, and red areas were warmer. Modeled temperatures are similar to those of the historical record, and they suggest that the drop in solar output shifted the North Atlantic Oscillation to its negative phase, causing cooling. (Map adapted from Shindell et al., 2001, copyright AAAS 2001*.) | ||
