|
Finding the Hot Spots |
|||
It was with these ideas in mind that Tucker and his colleague Jelle Hielkama, at
the FAO in Rome, pioneered a satellite-based approach to monitoring the desert
locust habitat in the early 1980s. The approach was based on a common satellite
indicator of vegetation called NDVI, for Normalized Difference Vegetation Index.
(The article Measuring Vegetation, NDVI
& EVI contains a thorough explanation of the remote sensing of vegetation.)
Vegetation has two key spectral characteristics: it absorbs light from the red
part of the electromagnetic spectrum for photosynthesis, and it reflects
electromagnetic energy from the near infrared (IR) part of the spectrum in order
to keep itself cool. If the satellite passes over an area that is heavily
vegetated, it should receive a reflected signal that is low in red light and
high in infrared light. If it passes over bare soil, the amount of red light
that is reflected increases significantly. |
|||
These relationships are calculated using a simple equation: the amount of red light received by the satellite subtracted from the amount of infrared light, divided by the combined signal received for both wavelengths. Values range from -1 to +1. NDVI= (IR - red)/ (IR + red) If the reflected infrared signal is high and red is low, then NDVI will be positive, signaling green vegetation. If no green vegetation is present, the amount of infrared light and red light reflected from the Earth’s surface will be comparable, and the NDVI will be near zero, signaling bare ground. Among the first things Tucker and Hielkama needed to find out was how much spatial detail they would need in their satellite images to track significant changes in NDVI. With satellite data, there is always a trade off between how much spatial detail is contained in the data, called spatial resolution, and the area that can be seen at one time, called spatial coverage. The greater the resolution, the smaller the spatial coverage, and the more time it takes to obtain information on a big area like the desert locust recession area. In the desert, rainfall is unpredictable, and the impacts can be fleeting. If you had to wait two or three weeks to see the same area twice, you might miss an important change. “Given the technology available in the 80s—before worldwide digital networks and before everybody had powerful computers for data processing—we knew that to create something operationally useful, it would have to be simple, both conceptually and technically. It also needed to be low-cost,” says Tucker. Since a higher amount of detail leads to bigger data file sizes, the researchers would want to pick the lowest, or coarsest, spatial resolution data they could while still capturing the important information. At that time, scientists were already using Landsat data to map ecological
conditions throughout the world, and on first glance that might have seemed a
natural choice. But Tucker knew that to cover the entire recession area using
30-m-resolution data from the Landsat Thematic Mapper would require acquisition
of at least 700 separate scenes. At $2800 a scene, that option was well outside
practical operating costs. Not to mention, Landsat typically only imaged the
exact same area once every 16 days (under favorable, cloud-free conditions),
which is not frequently enough to detect the more fleeting changes in desert
vegetation. To make the project work, Tucker and Hielkama’s first task was
to demonstrate that adequate monitoring could be done with coarser,
1-km-resolution data available from the National Oceanic and Atmospheric
Administration’s Advanced Very High Resolution Radiometer (AVHRR). |
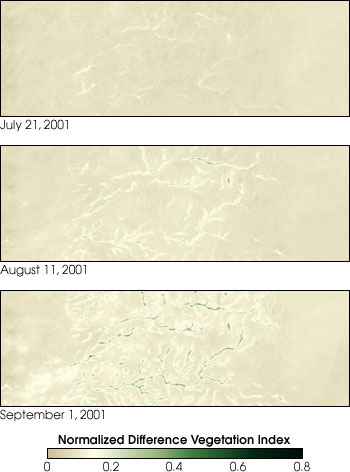
Normalized Difference Vegetation Index data from satellites show the greening of the desert. In August and September 2001, patches of vegetation appeared in the desert of Mali and Niger. Satellite observations occur regularly even over the most remote areas, allowing locust control organizations to monitor potential outbreaks. (Image by Robert Simmon, NASA GSFC, based on SPOT Vegetation Products) | ||
First, they selected numerous test sites throughout desert regions in Mali and Algeria in Africa and the Thar Desert in India and Pakistan that were known to be high-frequency breeding sites for the desert locust. Then they put on their safari hats and took to the desert, collecting ground-based observations of vegetation cover at the sites, some of which were wadis, or water channels. It was these sites that represented the greatest challenge for coarse resolution data. Having vegetation clumped together in a wadi is a perfect way to bring sufficient numbers of locusts close enough together for them to begin rubbing each other the wrong way. Their field work showed that wadis were anywhere from 30 meters to 1000 meters wide (98 to 3281 ft). Would 1 kilometer AVHRR data be sufficient to track changes there, or would it be like looking for a needle in a haystack? To demonstrate that their idea would work, Tucker and colleagues created a map
of the test sites using 30-meter-resolution data from Landsat. With the wadi
channels well identified on the satellite imagery and confirmed by field work,
the scientists created a grid overlay simulating the data that would come from
AVHRR. The map revealed that although in many cases the green vegetation took
up so little of an AVHRR-sized grid box (or pixel of data) that it might be
missed by the sensor, a sufficient number of grid boxes were at least 40 percent
filled with vegetation, which would be enough to detect significant change in
the amount of vegetation in the desert locust habitat. |
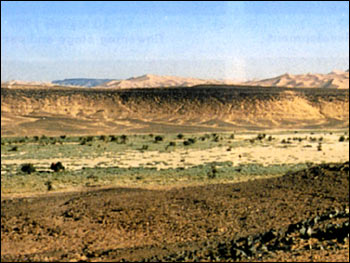
Water in the desert flows through channels called wadis. These wadis are often green with life when the wider expanses of desert are bone dry and barren. (Photograph courtesy Compton Tucker, NASA GSFC) | ||
“There was opposition initially to the use of coarse resolution data. The important point we were trying to make was that with the frequent satellite coverage of the area, there was a lot of remotely sensed information over time. It matters less if conditions are changing at lower resolution, and more that conditions are changing over time.” Tucker showed that if they used high-resolution data initially to map out the terrain and locate wadis or other small patches of vegetation, then they could recognize the changes in vegetation that appear over time in the coarse resolution data, even if they were somewhat subtle. |
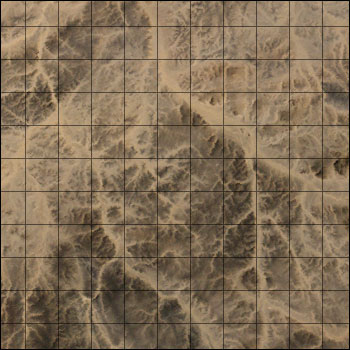
Dry wadis appear beige against a darker background in this satellite image of the Sahara desert near the border of Mauritania and Algeria. Each pixel is 30 by 30 meters. The grid overlay represents the 1-km resolution of the Advanced Very High Resolution Radiometer data used for monitoring locusts by the FAO. AVHRR data show vegetation in channels that cover 40 percent or more of a pixel. (Image by Robert Simmon, NASA GSFC, based on Landsat Thematic Mapper data archived by the Global Land Cover Facility) |