
While the societal and scientific value of groundwater measurements from space was always clear, scientists were initially hesitant to trust GRACE. “We claimed we could measure water under the ground,” says Byron Tapley. “The ability to penetrate the Earth from space is a paradigm shift for a community of hydrologists who are used to measuring underground water from wells.”

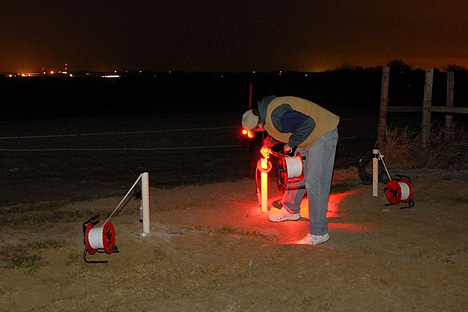
A United States Geological Survey researcher measures groundwater levels in a well near Oakland, Nebraska. (Photograph courtesy USGS Multimedia Gallery.)
To convince them that GRACE was indeed measuring groundwater, the science team set out to find a location without water. “We tried to do a test to show that there was no gravity signal over very dry regions,” says Tapley. The perfect candidate would be the world’s largest desert: the Sahara. The test didn’t work: “It turned out that there’s a fairly large aquifer under the Sahara Desert.”
So instead of looking for a place where there was little ground water, the team turned their attention to where there was a lot. One of the largest aquifers in the United States is buried under the state of Illinois. Nineteen major wells tap the aquifer, providing a network of ground measurements of the water table.
Those measurements—the sort hydrologists are used to—matched GRACE observations. Additional measurements of groundwater in Oklahoma, California, and India provided even more validation.
Over time, evidence and confidence mounted. As Rodell and Famiglietti published result after result, scientists began to recognize the potential of GRACE data. “People eventually realized that if you’re interested in measuring deep soil moisture or ground water from space,” Rodell says, “GRACE is the only game in town.”
Being able to see groundwater change is nice, but to make that measurement useful to decision makers, Wardlow needed to put the measurement into context. Just how bad was the 2011 drought compared to others in the past century? GRACE has only been in orbit since 2002, so how could Wardlow compare 2011 to droughts in the 1970s or 1950s?

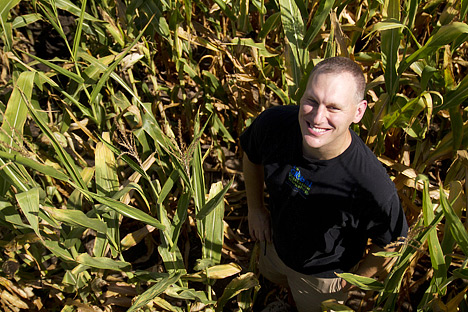
Brian Wardlow combines ground measurements with GRACE data to map soil moisture and ground water throughout the United States. (Photograph courtesy University of Nebraska, Lincoln.)
When challenged to provide that context, Rodell’s solution was a simulation of his land surface model based on historical meteorological data from 1948 to the present. After ensuring that the introduction of GRACE data into the model in 2002 did not cause any sudden shifts in the model’s depiction of reality, Rodell used the six-decade simulation to compare with current conditions.
“For each week, we look at the water storage in the current week versus our long-term record from the model,” says Rodell. The comparison allows Rodell to rank drought conditions and to provide much needed context. For instance, a severe drought might be ranked at two percent, meaning that since 1948, conditions were drier just two percent of the time. After three years of developing and refining his method, Rodell started to deliver GRACE products in 2011 to Wardlow.
This method of presenting GRACE measurements as a percent of normal was just what the drought monitors needed. “It allows us to compare GRACE groundwater with other drought indicators,” says Wardlow. “It helps the drought analysts converge on a category of drought severity.” That decision is important because farmers, insurance companies, and government officials use the assessment to determine the level of response to a drought.
“On a practical level, there is some hesitancy and some skepticism to use the data sets,” admits Wardlow. “The drought monitors like to look at things over a period of a year or two years to see if the patterns make sense. So we’re still in that buy-in period.”
But if GRACE has proven anything, it’s that it can overcome doubt.